Urban Air Mobility is often promoted as a way to avoid congestion, but that promise needs to be tested carefully. A flying vehicle can be fast in the air, yet the full trip still includes ground access, transfers at vertiports, waiting time, and the final trip from the destination vertiport to the traveler’s actual destination.
Bulusu, Onat, Sengupta, Yedavalli, and Macfarlane study this full-trip problem for the San Francisco Bay Area. Their paper develops a traffic demand analysis method that asks a practical question: how many commuters would actually benefit from switching from a road commute to a multimodal UAM trip?
The answer depends heavily on congestion, vertiport locations, transfer time, and the minimum time savings commuters require before switching modes.
The Core Idea
The study compares two versions of the same commute.
The first is the normal road trip from origin to destination. The second is a multimodal UAM trip: drive to an origin vertiport, fly to a destination vertiport, then drive to the final destination.
UAM is considered beneficial only when the multimodal trip saves enough time compared with the road-only commute. This is important because the aircraft speed alone does not determine usefulness. A short flight can be canceled out by long access drives or slow transfers.
Data for the Bay Area Case Study
The authors use commute trip data from the San Francisco County Transportation Authority’s CHAMP 6 model. The dataset includes 327,579 commute trips across the Bay Area and represents about 70% of daily car trips in the region.
The study focuses on east-to-west and west-to-east commute flows, which are important because the Bay Area has strong directional commute patterns and major geographic barriers such as the bay itself.
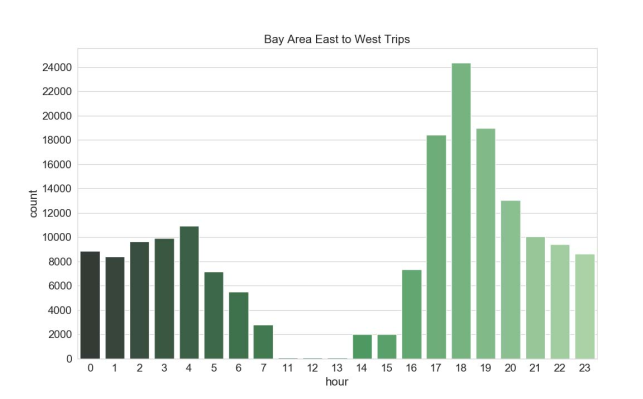
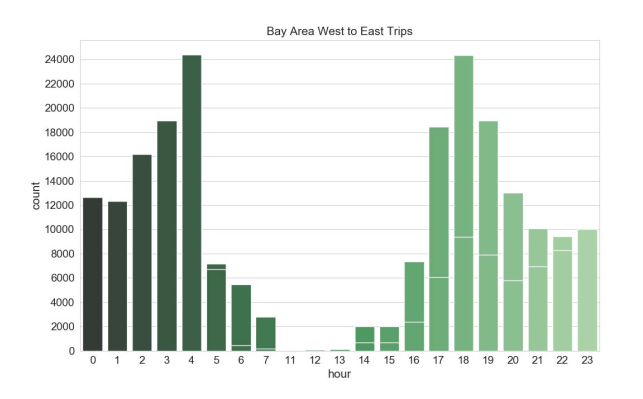
This direction-specific analysis matters because a UAM network may not serve all travel equally. It may be most useful where road routes are indirect, bridges are congested, or commute corridors are long and predictable.
Building the UAM Trip
For each commuter trip, the method builds a possible UAM alternative.
First, the traveler drives from the origin to the nearest origin vertiport. Then the aircraft flies from that vertiport to a destination vertiport. Finally, the traveler drives from the destination vertiport to the final destination.
The aircraft is assumed to fly straight-line paths between vertiports at an average speed of 100 mph. The study also assumes four-passenger aircraft. Transfer times at vertiports are tested at 5, 10, and 15 minutes.
Those transfer times are critical. A five-minute transfer makes UAM much more attractive. A fifteen-minute transfer can erase the benefit for many trips, especially shorter commutes.
Choosing Vertiport Locations
The study uses k-means clustering to locate candidate vertiports. The goal is to place vertiports near clusters of commuter origins and destinations, reducing access and egress time.
Different vertiport-count scenarios are tested because the number of sites affects both access and capacity. More vertiports generally reduce ground access time, but they also require more infrastructure, land, permitting, and operational coordination.
This is one of the central planning tradeoffs in UAM. A sparse network may be cheaper to build but inconvenient for passengers. A dense network may capture more demand but become difficult and expensive to deploy.
When Does a Commuter Benefit?
The paper tests different assumptions about how much time a commuter must save before UAM is considered beneficial.
For long-distance commuters, the minimum travel time saving threshold is 25%. For short-distance commuters, the threshold is 50%. This reflects a realistic behavioral idea: people are unlikely to switch modes for tiny improvements, especially if the new mode is more expensive or requires transfers.
In other words, UAM must provide a meaningful time advantage. It is not enough to be slightly faster.
High-Congestion Results
Under high road congestion, UAM becomes much more attractive.
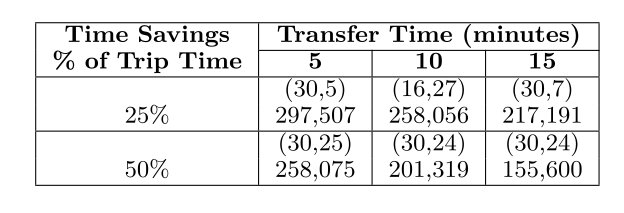
The study finds that even with 15-minute transfer times and a high time-saving requirement, about 45% of commuters could benefit from UAM. With shorter 5-minute transfers and a lower time-saving threshold, up to 90% of commuters could benefit.
That range is wide, and that is the point. UAM demand is highly sensitive to assumptions. A network with fast transfers and severe road congestion can look very promising. A network with slow transfers is much less attractive.
Low-Congestion Results
The picture changes under low road congestion.
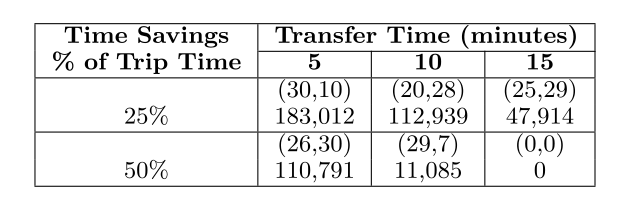
When roads are uncongested, fewer commuters benefit from UAM. With 5-minute transfer times and flexible time-saving requirements, about 33% of commuters benefit. For travelers who require larger time savings, especially with longer transfers, the benefit becomes much smaller.
This result is intuitive but important. UAM is not universally valuable. It is most useful when ground travel is slow, indirect, or unreliable.
What the Vertiport Results Teach
The optimal vertiport combinations differ between high- and low-congestion scenarios. That means a network designed for rush-hour congestion may not be ideal for off-peak travel.
This is a difficult planning problem. Vertiports are fixed infrastructure, but demand and congestion change by time of day. A good UAM network must perform well under the conditions where it creates the most value, while still being usable outside peak periods.
The study’s method helps planners test those tradeoffs before building infrastructure.
Why Transfer Time Is So Important
Transfer time appears repeatedly as one of the most important variables. This includes boarding, walking, waiting, security or identity checks, vehicle turnaround, and any operational friction at the vertiport.
A UAM trip may look excellent when only flight time is counted. But if passengers spend 10 or 15 minutes at each end of the flight process, the advantage shrinks quickly.
This is why passenger experience and operations matter as much as aircraft speed. UAM must be designed as a door-to-door service, not only a fast airborne segment.
Why This Matters for UAM Planning
The value of this paper is that it provides a method, not just one forecast. The method can be adapted to other cities by changing commute data, road travel times, candidate vertiport locations, aircraft speed, transfer time, and time-saving thresholds.
For planners, the main lessons are clear:
- UAM demand depends strongly on road congestion.
- Vertiport placement controls access and egress time.
- Transfer time can make or break the service.
- Short trips need very large percentage savings to be attractive.
- Long trips are more promising when road routes are congested or indirect.
- Aircraft speed is only one part of total trip performance.
Limitations
The study focuses on commuter trips, not airport access, business travel, leisure travel, cargo, or emergency services. It also assumes straight-line aircraft paths, a fixed aircraft speed, and simplified transfer times.
Real-world UAM operations would face additional constraints: weather, airspace routing, noise limits, vertiport capacity, charging, pricing, passenger willingness to fly, and regulatory requirements.
Even so, the framework is valuable because it forces UAM demand to compete against actual road travel time. That is the right starting point.
Final Thoughts
The San Francisco Bay Area case study shows that UAM can offer meaningful benefits under the right conditions, especially during high congestion and on longer or indirect commute corridors.
But it also shows that UAM is fragile as a value proposition. If transfers are slow, vertiports are poorly located, or roads are uncongested, the advantage shrinks quickly.
The main takeaway is simple: UAM should be planned around total journey time. The aircraft may be fast, but the system only works if the full trip is faster, convenient, and reliable enough for commuters to change behavior.
References
- Bulusu, V., Onat, E.B., Sengupta, R., Yedavalli, P. and Macfarlane, J., 2021. A Traffic Demand Analysis Method for Urban Air Mobility. IEEE Transactions on Intelligent Transportation Systems, 22(9), pp. 6039-6047. https://doi.org/10.1109/TITS.2021.3052229
- IEEE Xplore record. https://ieeexplore.ieee.org/document/9325892