Advanced Air Mobility will not succeed just because an eVTOL aircraft can fly. It has to work as a transportation system. That means passengers must be picked up on time, aircraft must be available where demand appears, vertiports must have enough capacity, and the airspace must handle the resulting traffic.
The paper “Demand and Capacity Modeling for Advanced Air Mobility” by Alvarez, Jones, Bryan, and Weinert studies this system-level problem using New York City as a test case. Instead of only asking how many people might want air taxi service, the authors ask a more operational question: if some taxi trips shift to eVTOL aircraft, can the network actually serve them without unacceptable delays?
Why Demand and Capacity Must Be Studied Together
Demand tells us where passengers want to travel. Capacity tells us whether the system can serve them.
Those two questions are tightly connected. A city may have strong demand for air taxi trips, but if the fleet is too small, the vertiports are too crowded, or aircraft spend too long repositioning, the service will feel unreliable. On the other hand, building too much capacity too early can make the system financially unsustainable.
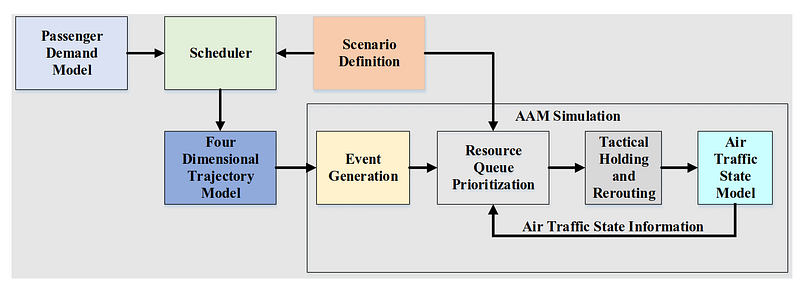
That is why the paper builds a flexible simulation framework. It combines demand modeling, aircraft scheduling, and discrete-event simulation so researchers can test how fleet size, aircraft passenger capacity, and landing-site capacity affect performance.
Using New York Taxi Data as a Demand Proxy
Because large-scale AAM service does not yet exist, the study uses historical New York taxi data as a proxy for potential urban air mobility demand. The dataset includes yellow taxis, green taxis, and for-hire vehicles from 2009 to 2019. The authors focus on the 2016 data because it provides higher-resolution pickup and drop-off locations.
The idea is not that every taxi trip becomes an air taxi trip. Instead, taxi data provides a detailed picture of when and where people request point-to-point mobility in a dense city. That makes it a useful starting point for testing hypothetical AAM operations.
Modeling Requests with a Poisson Process
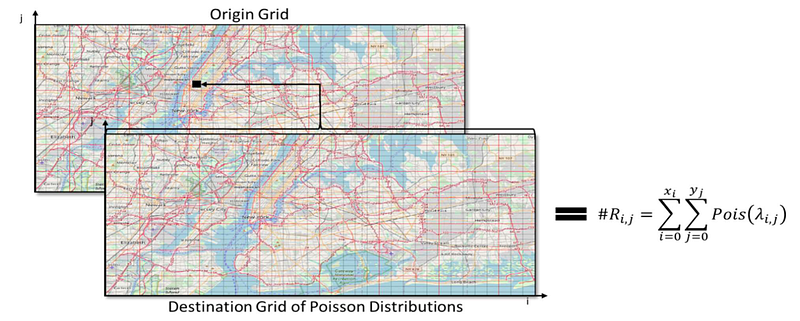
The demand model captures both space and time. New York City is divided into a fine grid, and each grid cell can act as an origin or destination. For each hour, the model estimates how many trips may occur between origin-destination pairs.
The authors use a Poisson distribution to sample possible request counts. This is a common approach when modeling events that occur randomly over time, such as trip requests. If a historical origin-destination pair has a known request rate, the Poisson model can generate simulated demand for a future time window.
This matters because AAM planning cannot rely only on daily totals. A system that serves 10,000 passengers per day may still fail if too much demand appears at the same place during the same hour. The temporal and spatial pattern is what creates the real operational challenge.
Choosing Vertiport Locations
The study uses k-means clustering on a year of demand data to help identify candidate vertiport locations. The final network includes 29 candidate vertiports selected from existing heliport locations, open fields, and areas near major demand centers.
This is a practical compromise. A purely mathematical clustering result may place sites where construction is impossible. A purely infrastructure-driven plan may ignore demand. Combining demand concentration with plausible landing locations helps create a more realistic network.
The route network uses existing New York helicopter corridors, and shortest paths between vertiports are computed using Dijkstra’s algorithm. That choice keeps the simulated air traffic closer to operationally plausible routes instead of assuming aircraft can fly anywhere without airspace constraints.
Scheduling Aircraft
The scheduler assigns aircraft to passenger requests based on the closest available aircraft and the current state of the fleet. It uses a greedy approach: choose an aircraft that can serve the trip quickly, with attention to available seats and waiting time.
Each aircraft can be in a different state, such as waiting for assignment, traveling to pick up passengers, carrying passengers, or moving through the network. The scheduler has to make rapid decisions because demand appears continuously.
This is where fleet size and passenger capacity start to matter. A larger aircraft may serve more passengers per flight, but only if requests can be grouped efficiently. A larger fleet may reduce waiting time, but it also increases airspace density and infrastructure pressure.
Simulating Operations
The discrete-event simulator tracks the system as events happen over time. Aircraft arrive, depart, board passengers, wait for vertiport availability, fly through corridors, and sometimes experience delays.
This lets the authors measure performance in operational terms:
- Passenger delay.
- Ground delay.
- Air delay.
- Vertiport utilization.
- Aircraft utilization.
- Diversions or unserved demand.
- Traffic density compared with existing air traffic.
These metrics are more useful than a simple demand forecast because they show where the system breaks under load.
What Happens Without Resource Constraints
The authors first test unconstrained scenarios with fleet sizes ranging from 200 to 6,000 aircraft. This helps isolate how aircraft passenger capacity affects the number of simultaneous operations needed to serve demand.
One important result is that increasing passenger capacity can dramatically reduce the number of aircraft required. In the study, increasing vehicle capacity from four passengers to six passengers reduced simultaneous aircraft operations by roughly 50% in some scenarios.
That is a major finding. In dense urban airspace, the number of aircraft matters not only for cost but also for safety, noise, scheduling, and air traffic management. A slightly larger vehicle may reduce system complexity more than simply adding more small aircraft.
What Happens When Vertiports Are Constrained
The study then introduces resource limits, especially the number of landing pads available at vertiports. This is where the simulation becomes more realistic. In a city like New York, vertiport capacity will be expensive, politically sensitive, and physically limited.
The results suggest that increasing passenger capacity has a stronger effect on reducing trip delays than adding more vertipads. In other words, the system may benefit more from moving more people per aircraft than from simply expanding landing infrastructure.
The paper identifies a scenario around 1,700 aircraft with no additional vertipads as a useful operating point for keeping average trip delays below 15 minutes. That number should not be treated as a universal requirement for AAM, but it shows the scale of operations needed when replacing a meaningful share of taxi demand in a dense city.
Where Delays Concentrate
The delay patterns are not evenly distributed. Vertiports in high-demand areas, especially Lower Manhattan, experience the highest pressure. This is exactly what planners should expect: demand concentrates around employment centers, tourist areas, transit hubs, and dense commercial districts.
The study finds that increasing aircraft capacity from four to six passengers can significantly reduce delays at these critical locations. That suggests vehicle design and infrastructure planning should be studied together. A vertiport’s capacity problem may sometimes be eased by better aircraft capacity or scheduling, not only by adding pads.
Why This Matters for AAM Planning
The most useful lesson from this paper is that AAM feasibility depends on system interactions.
A demand model alone may say a market is attractive. A fleet model alone may say enough aircraft are available. A vertiport model alone may say a site can handle a certain number of operations. But the real question is what happens when all of those pieces interact minute by minute.
For urban air mobility, the bottleneck may shift depending on the scenario. Sometimes the fleet is too small. Sometimes vertiports are saturated. Sometimes aircraft are in the wrong place. Sometimes airspace density becomes the limiting factor. Simulation helps reveal which constraint matters most.
Limitations
The study uses taxi demand as a proxy, so it inherits the limits of that assumption. Future AAM passengers may behave differently from taxi riders because of price, access time, vertiport location, weather, willingness to fly, baggage needs, safety perception, and schedule reliability.
The simulation also depends on assumptions about aircraft capacity, turnaround time, fleet size, routing, and vertiport design. Changing those inputs can change the results. That is not a weakness of the framework; it is why the framework is useful. It allows planners to test sensitivity before making expensive infrastructure decisions.
Final Thoughts
Demand and capacity modeling is one of the most important pieces of AAM planning. A city may have strong theoretical demand for air taxis, but the service will only work if the fleet, vertiports, routes, and scheduler can absorb that demand without creating long delays or unsafe traffic density.
This paper shows why AAM should be evaluated as a networked operation, not a collection of individual flights. The best design decisions may come from balancing aircraft size, fleet size, vertiport capacity, and routing together.
For early AAM deployment, that kind of modeling can help answer the questions that matter most: where should service begin, how large should the fleet be, how much infrastructure is enough, and what level of demand can the system realistically handle?
References
- Alvarez, L.E., Jones, J.C., Bryan, A. and Weinert, A.J., 2021. Demand and Capacity Modeling for Advanced Air Mobility. In AIAA Aviation 2021 Forum (p. 2381). https://doi.org/10.2514/6.2021-2381
- MIT Lincoln Laboratory, Demand and capacity modeling for advanced air mobility. https://www.ll.mit.edu/r-d/publications/demand-and-capacity-modeling-advanced-air-mobility