Safety rules often prevent tragedies that never happen. A stronger vehicle standard, safer roadway design, better aviation procedure, or improved rail regulation may reduce the probability of fatal injury across millions of people. The challenge for economic analysis is that those benefits are real, but they are probabilistic.
That is where the Value of a Statistical Life, or VSL, comes in. VSL is not the price of one person’s life. It is a way to measure how much people are willing to pay for small reductions in fatality risk, aggregated across a population.
What VSL Actually Means
The phrase “Value of a Statistical Life” can sound uncomfortable because it appears to put a dollar value on human life. That is not what the measure is trying to do.
VSL values risk reduction. Suppose 10,000 people each face a small safety risk, and each person is willing to pay $1,000 to reduce their annual chance of death by 1 in 10,000. Across the group, the risk reduction adds up to one expected fatality avoided. The total willingness to pay is $10 million, so the implied VSL is $10 million.
The key word is expected. Analysts are not identifying a specific person and assigning a value to that person’s life. They are estimating the public benefit of reducing small risks across a large group.
Why Agencies Use VSL
Government agencies must often compare the costs and benefits of safety actions. A regulation may require companies to install safer equipment. A transportation investment may redesign a dangerous road segment. A new rule may reduce crash, injury, or fatality risk.
These actions cost money. They may also save lives. To evaluate them consistently, agencies need a way to express safety benefits in monetary terms so they can be compared with implementation costs.
The U.S. Department of Transportation uses VSL in benefit-cost analysis for regulations, infrastructure investments, and policy decisions that affect transportation safety. DOT has published guidance on valuing reductions in fatalities and injuries since 1993, with major methodology updates and annual adjustments for inflation and real income growth.
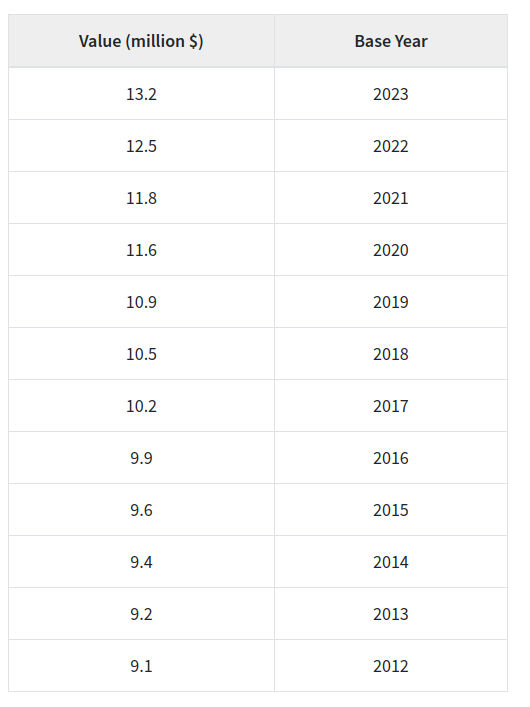
The Current DOT VSL
Under DOT’s current guidance page, the VSL estimate for analyses using a 2025 base year is $14.2 million. The same page lists prior-year values, including $13.7 million for 2024, $13.2 million for 2023, and $12.5 million for 2022.
These values are updated because willingness to pay for safety changes over time with prices and real income. When analysts conduct a benefit-cost analysis, they should use the VSL value corresponding to the base year of the analysis, not simply reuse an older number.
This matters in practice. A safety rule that prevents 10 expected fatalities would generate very different monetized benefits depending on whether the analysis uses an outdated VSL or the current DOT value.
Willingness to Pay and Risk Reduction
VSL is rooted in willingness to pay. The basic idea is that people make tradeoffs involving safety all the time. They may pay more for a safer car, accept a lower wage for a safer job, choose safer transportation, or buy protective equipment.
Economists use these observed or stated preferences to infer how people value reductions in fatal risk. If many people are willing to pay small amounts for small risk reductions, those small values can be aggregated into the value of one expected fatality avoided.
This method replaced older approaches that valued life mainly through lost earnings. The earnings approach was too narrow because it treated a person’s value as economic productivity. Willingness-to-pay methods are broader because they reflect how individuals value risk reduction itself, not only income loss.
Revealed and Stated Preference Studies
VSL estimates usually come from two types of studies: revealed preference and stated preference.
Revealed preference studies look at real market behavior. A common example is hedonic wage analysis, where researchers estimate how much extra pay workers require to accept more dangerous jobs. Consumer studies can also reveal how people value safety when they buy products with different risk profiles.
Stated preference studies ask people directly about hypothetical safety choices. For example, a survey may ask how much someone would pay for a product, policy, or service that reduces fatality risk by a defined amount.
Both methods have strengths and weaknesses. Revealed preference studies use real decisions, but people may misunderstand risk or face limited choices. Stated preference studies can describe risks more precisely, but hypothetical answers may not match real behavior. DOT guidance synthesizes the literature rather than relying on a single study.
Benefit Transfer
One practical issue is benefit transfer. VSL estimates are often derived from one population or study context, then applied to other policy settings.
For example, a wage-risk study may estimate how workers value occupational safety, but a transportation rule may affect drivers, passengers, pedestrians, children, older adults, and people with disabilities. Analysts must decide whether to use one broad VSL value or different values for different groups.
DOT guidance applies a uniform nationwide VSL for the prevention of an expected fatality. That value does not vary by age, income, travel mode, or population subgroup. When a rule especially affects a specific group, analysts should describe those characteristics clearly, but they should not assign a different VSL to that group.
This policy choice supports consistency and avoids implying that safety benefits for different populations should be valued differently in departmental analyses.
Sensitivity Analysis
VSL is an estimate, not a physical constant. Different studies produce different values, and the estimate depends on data, methods, assumptions, and economic conditions.
That is why DOT guidance calls for sensitivity analysis. Analysts should test how results change when using high and low VSL values. If a regulation produces net benefits only under one narrow VSL assumption, decision-makers should know that. If the rule remains beneficial across a reasonable range, the case is stronger.
Sensitivity analysis is not a side note. It is part of honest economic analysis because it shows how much uncertainty matters.
How to Think About VSL Ethically
VSL can feel cold because it converts safety into dollars. But the alternative is not to avoid valuation. The alternative is often to make safety tradeoffs implicitly, inconsistently, or invisibly.
Transportation agencies must decide how much to invest in safer vehicles, better roads, aviation procedures, rail systems, pipelines, and hazardous materials controls. Those decisions affect lives. VSL helps make the safety benefit visible in the same analytical framework used for costs.
The ethical point is not that life has a market price. The ethical point is that reducing fatal risk has enormous social value, and public decisions should account for that value transparently.
Why This Matters for Transportation and AAM
For transportation research, VSL is especially important because many policies are safety-driven. Crash reduction, automation, air traffic management, advanced air mobility, vehicle design, infrastructure upgrades, and emergency response systems all involve changes in risk.
In emerging fields like Advanced Air Mobility, analysts may eventually need to compare safety investments across aircraft certification, vertiport design, airspace integration, automation, cybersecurity, and emergency procedures. VSL does not answer every safety question, but it helps quantify the benefits of reducing fatality risk in a consistent way.
The larger lesson is simple: safety is not only a technical requirement. It is also an economic and social value that should be measured carefully.
References
- U.S. Department of Transportation, Departmental Guidance on Valuation of a Statistical Life in Economic Analysis. https://www.transportation.gov/office-policy/transportation-policy/revised-departmental-guidance-on-valuation-of-a-statistical-life-in-economic-analysis
- U.S. Department of Transportation, Valuation of a Statistical Life Guidance. https://www.transportation.gov/sites/dot.gov/files/2021-03/DOT%20VSL%20Guidance%20-%202021%20Update.pdf