Regional Air Mobility sounds compelling in theory: smaller, cleaner aircraft connecting communities that are too far apart for convenient driving but not well served by today’s airline network. The harder question is whether enough people would actually use it.
That is where demand modeling becomes essential. Before operators can choose aircraft, schedule flights, size fleets, or invest in airports, they need a realistic estimate of where passengers may come from, where they want to go, and when air service becomes more attractive than driving.
Justin, Payan, and Mavris approach this problem using the U.S. Northeast Corridor as a case study. Their work combines travel demand data, cost modeling, travel time modeling, utility theory, and a multinomial logit mode choice model to estimate how regional air mobility could shift some travelers from cars to aircraft by 2040.
Why the Northeast Corridor Is a Useful Test Case
The Northeast Corridor is one of the densest and most economically important regions in the United States. It includes parts of New England and the Mid-Atlantic, including states such as Maine, Connecticut, Rhode Island, Vermont, New Hampshire, Massachusetts, New York, New Jersey, Pennsylvania, Maryland, Delaware, Virginia, West Virginia, and Washington, DC.
The region has around 74 million people, roughly 22% of the U.S. population. Yet fewer than 80 airports in the corridor receive scheduled commercial air service. That gap is exactly why advanced regional air mobility is interesting: there are many communities, many trips, and many underused airports, but not always convenient scheduled air service.
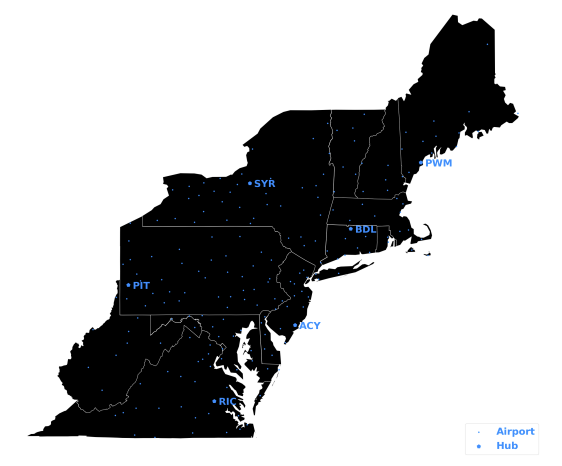
The paper selects six regional hubs for connecting RAM services. These airports are attractive because they are already small or medium hubs in the National Plan of Integrated Airport Systems, have useful ground infrastructure, are close to population centers, and are positioned to capture important regional flows without the congestion of major airline hubs.
The Core Modeling Question
The central problem is not simply “how many people travel?” The real question is: when RAM becomes available, which travelers would choose it instead of driving or using conventional air service?
That requires a mode choice model. Travelers compare options based on cost, time, convenience, reliability, access, and other less visible preferences. A new regional air service must beat the alternatives door to door, not just airport to airport.
The authors use historical 2008 data to calibrate their model, then apply it to a 2040 forecast scenario. This is a practical strategy: first prove the model can reproduce observed travel behavior, then use it to evaluate future RAM scenarios.
Starting from the Four-Step Travel Model
Traditional transportation planning often uses a four-step model: trip generation, trip distribution, mode choice, and route assignment.
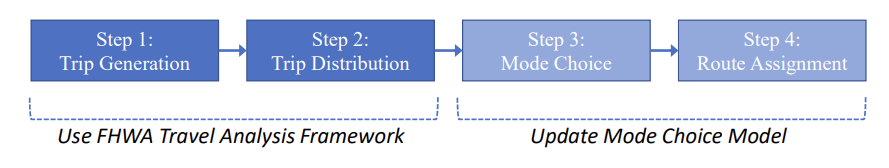
Trip generation estimates how many trips begin in each region. Trip distribution connects origins and destinations. Mode choice estimates whether travelers choose car, air, rail, bus, or another mode. Route assignment places those trips onto specific routes or itineraries.
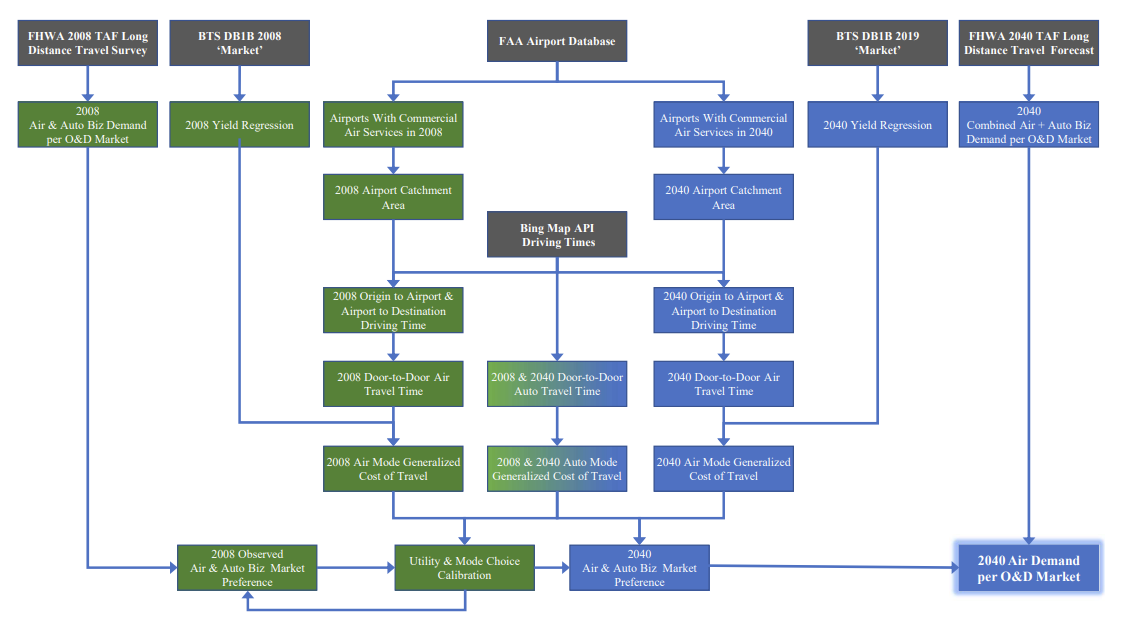
For this study, the authors use the Federal Highway Administration’s Travel Analysis Framework (TAF), which provides county-level long-distance passenger flows for trips above 100 miles. TAF includes observed one-way trips from 2008 and forecast demand for 2040 across air, automobile, rail, and bus.
Because TAF does not include future RAM as a mode, the study keeps trip generation and trip distribution intact, then modifies the mode choice step. In other words, the total travel market is not assumed to magically grow. Instead, the model asks how travelers may reallocate across modes once RAM becomes available.
Modeling Travel Cost
Travelers do not compare modes only by ticket price. They compare the full cost of the trip.
For driving, the paper estimates cost using IRS standard mileage rates and driving distances from Bing Maps. The trip is modeled from the population centroid of the origin county to the population centroid of the destination county, giving a door-to-door automobile cost.
For air travel, the authors use the Department of Transportation’s DB1B database, a 10% sample of U.S. airline ticket sales. They build a simplified airfare model using passenger yield, which is airfare normalized by distance.
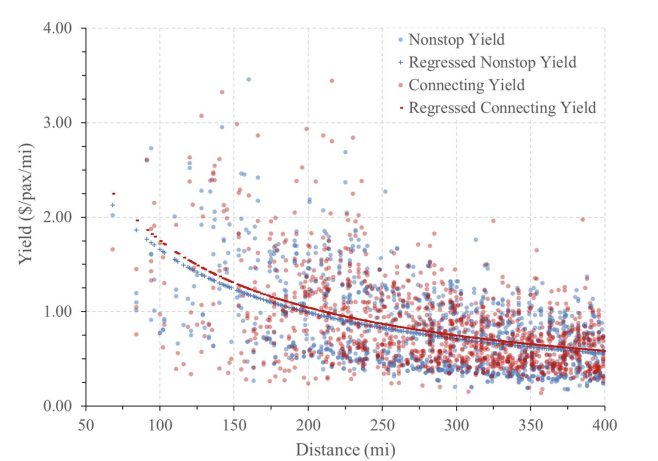
The analysis compares nonstop and connecting yields and finds that the difference is small enough to use a combined regression for forecasting.
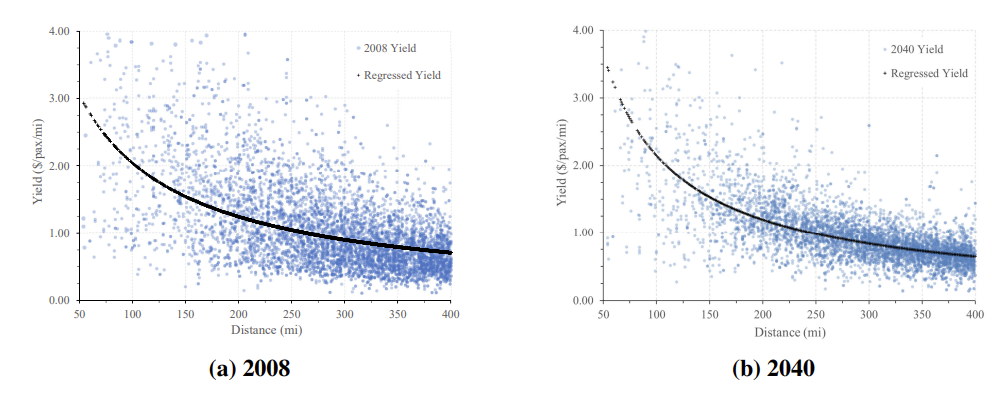
This is intentionally simpler than a full airfare model. Real prices depend on competition, booking time, airline strategy, time of day, aircraft size, and many other factors. But for regional demand modeling, the simplified yield relationship gives a usable estimate of monetary cost.
Modeling Travel Time
Time is often the reason regional air mobility becomes attractive. A flight may cost more than driving, but if it saves several hours, some travelers will switch.
For automobile travel, driving times are estimated through Bing Maps, including both quiet-hour and rush-hour conditions. For air travel, total time includes more than the flight. It includes driving to the airport, time spent at the airport, block time, possible connection time, and driving from the arrival airport to the final destination.
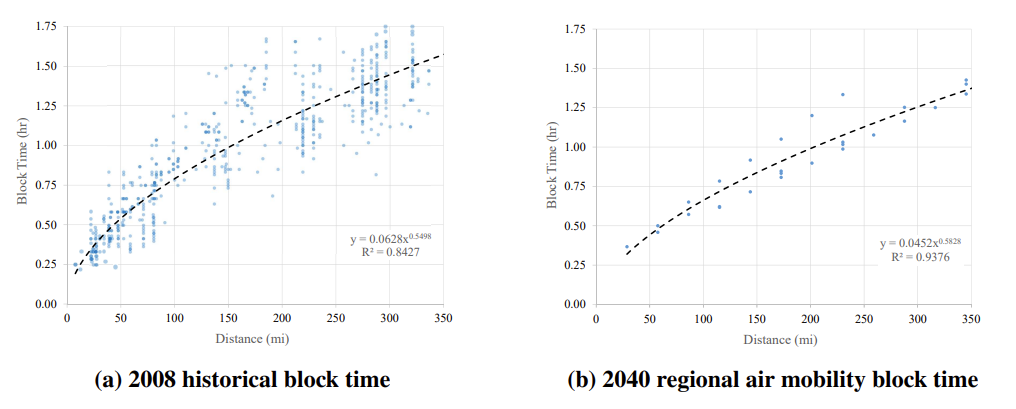
The paper assumes conventional 2008 air travel includes about 90 minutes of airport latency for check-in, security, and boarding. For 2040 RAM operations, that latency is reduced to 48 minutes, reflecting smaller regional airports and faster small-aircraft boarding.
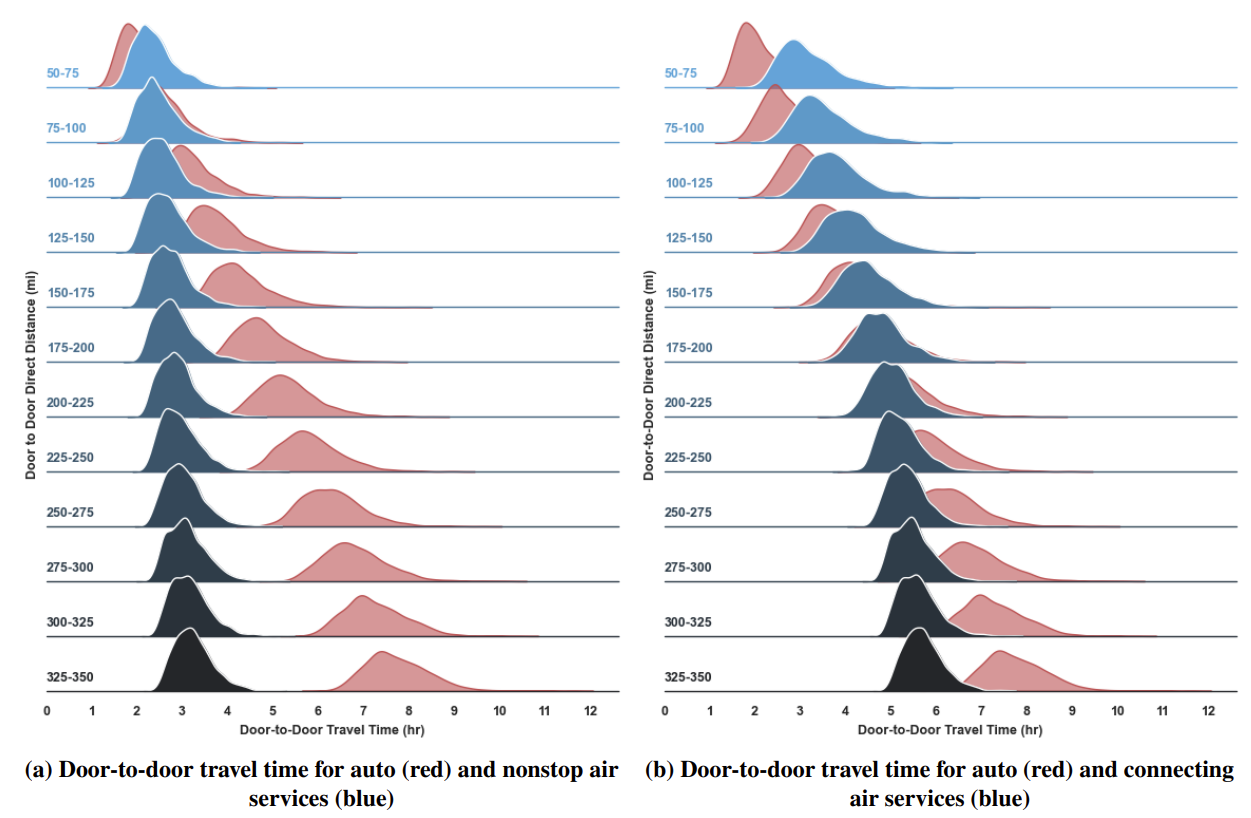
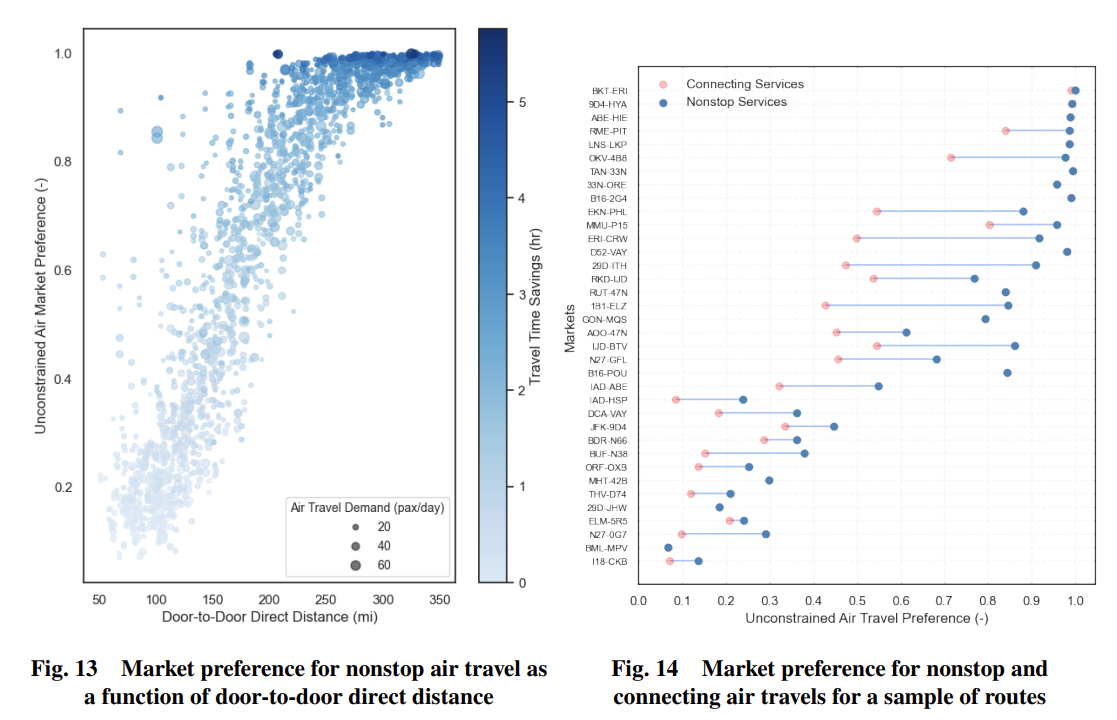
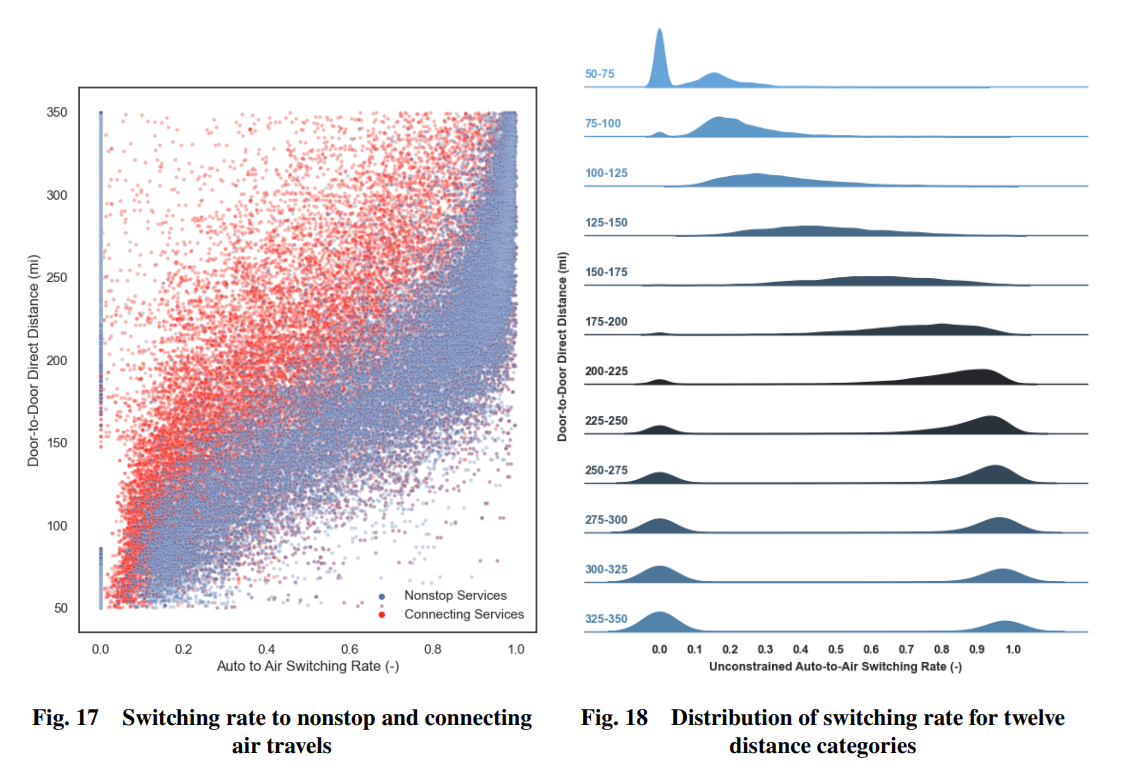
The time results are intuitive. For short trips, air travel struggles because airport access and waiting time dominate. For longer regional trips, especially above roughly 150 miles for nonstop service, the time savings become more meaningful. Connecting air service needs longer distances before it clearly beats driving because it adds routing and connection penalties.
Generalized Cost of Travel
To combine money and time into one decision metric, the study uses Generalized Cost of Travel. This concept adds direct monetary cost to the opportunity cost of time.
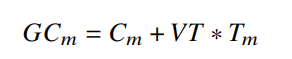
The opportunity cost of time is estimated using travelers’ value of time, derived from median hourly wage data from the Bureau of Labor Statistics. This lets the model compare a cheaper but slower car trip against a more expensive but faster air trip.
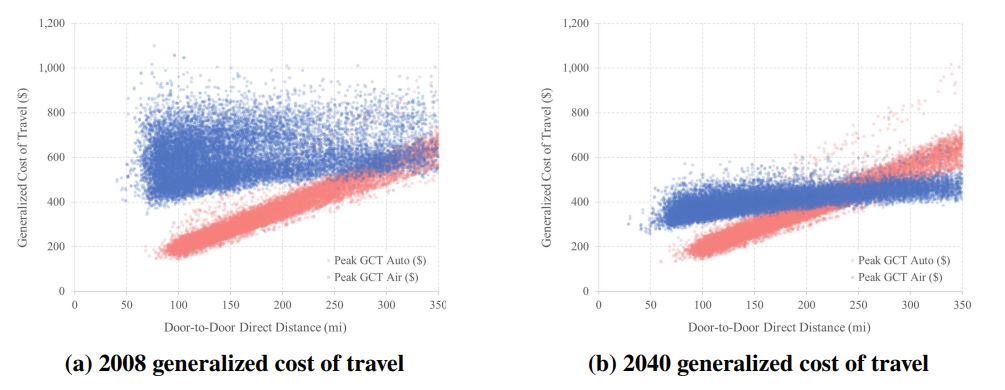
The important result is that air travel becomes more competitive in more markets in the 2040 RAM scenario than it was in 2008. That does not mean air wins everywhere. It means that shorter airport access, better regional airport use, and improved aircraft economics can make air travel attractive in markets that are currently underserved.
Utility and Mode Choice
The model assumes travelers prefer modes with lower generalized cost, but it also recognizes that not everything is captured in dollars and minutes. Air travel has friction, such as security and schedule constraints, but it also has benefits, such as productivity during the trip.
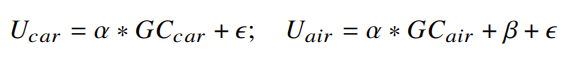
The authors represent these effects through utility functions and then use a multinomial logit model to estimate the probability that travelers choose air rather than automobile.
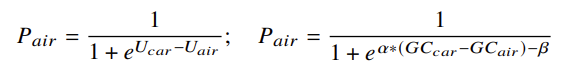
The model is calibrated against the observed 2008 TAF data using maximum likelihood estimation.
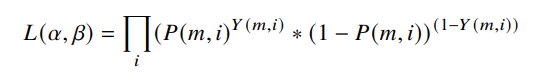

The calibrated model produces parameters that allow the predicted 2008 mode choices to be compared with actual observed choices. That validation step is important because it checks whether the model can reproduce known behavior before forecasting future behavior.
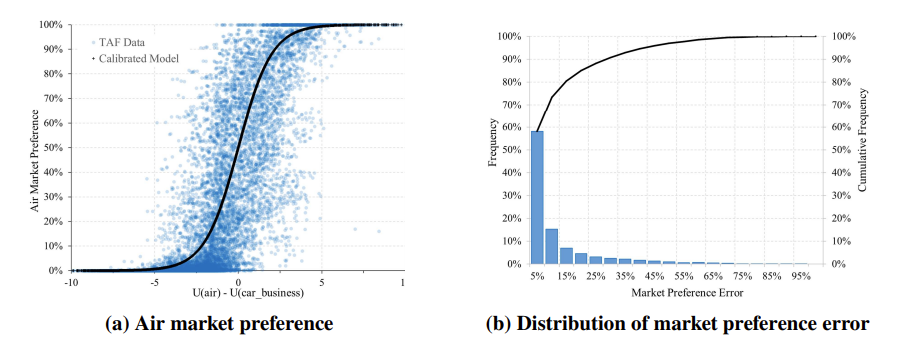
The paper reports that 80% of markets have less than 15% market preference error, which gives the authors enough confidence to apply the model to 2040 scenarios.
What the 2040 Demand Estimates Show
The forecast shows that not every regional market can support service. Many origin-destination pairs have fewer than 10 passengers per day, which may be difficult to serve economically without subsidy or cargo support.
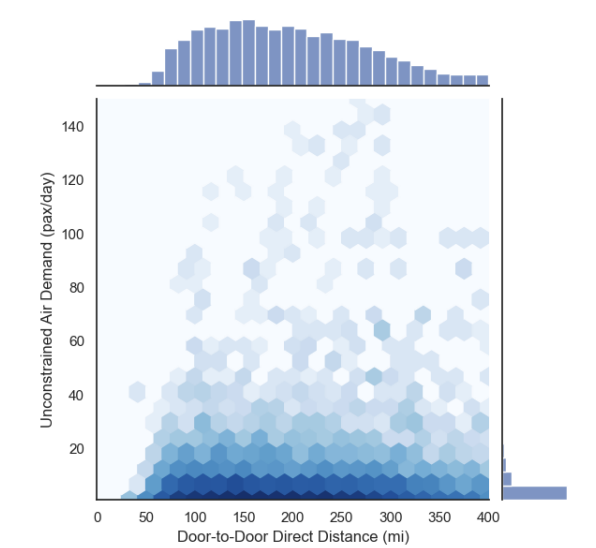
The more promising markets are in the range of about 10 to 75 passengers per day and 50 to 350 miles. These are not necessarily the largest city pairs. In fact, the study suggests that RAM may be most useful in markets that are too thin for conventional airline service but large enough to support small-gauge regional aircraft.
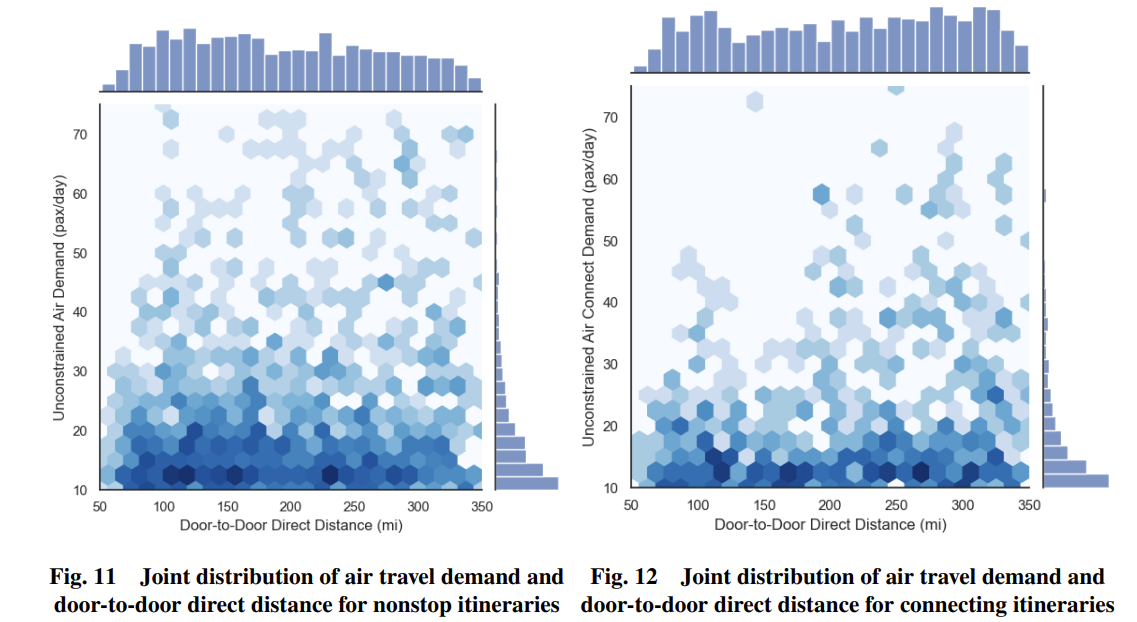
Nonstop itineraries are consistently more attractive than connecting itineraries. This is expected because nonstop service saves time and avoids connection penalties. Connecting service may still matter for network coverage, but it is less likely to pull travelers out of cars on shorter routes.
The model also estimates auto-to-air switching among business travelers. As trips get longer, the relative time savings from RAM generally increase, and more travelers are willing to shift from driving to air.
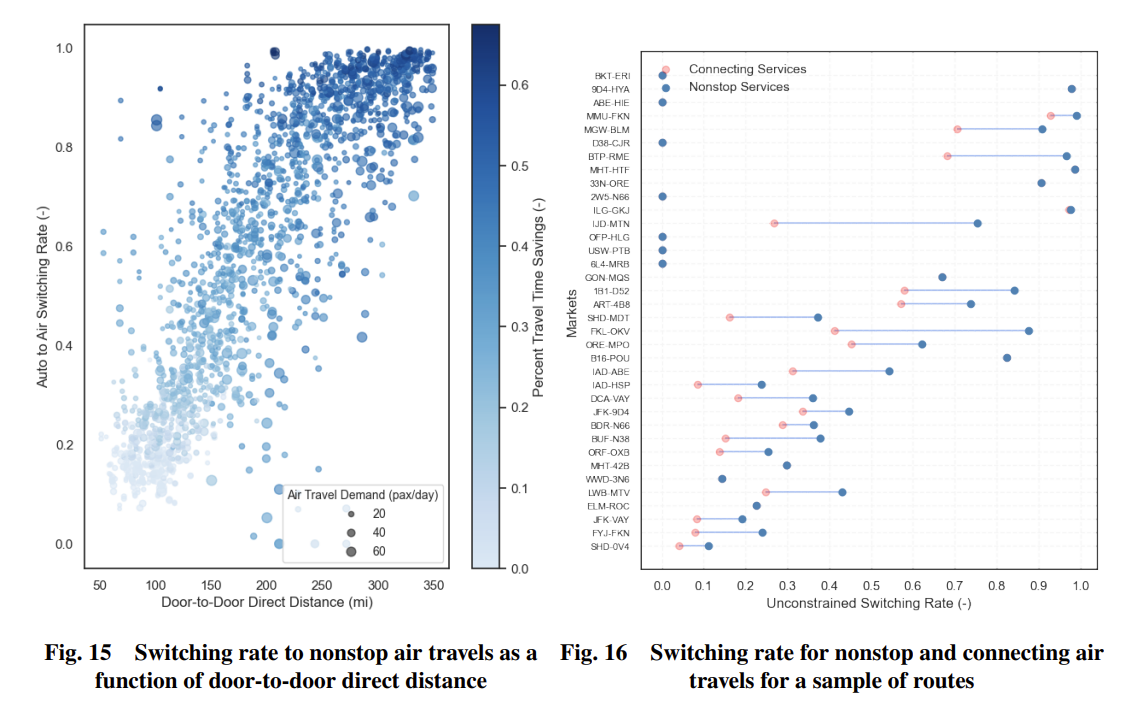
One important nuance is that the switching rate is not always highest on the longest routes. For very long trips, many travelers are already predicted to fly in the baseline forecast, so there may be fewer drivers left to convert. The strongest RAM opportunity often sits in the middle: trips long enough for major time savings, but not already well captured by conventional air service.
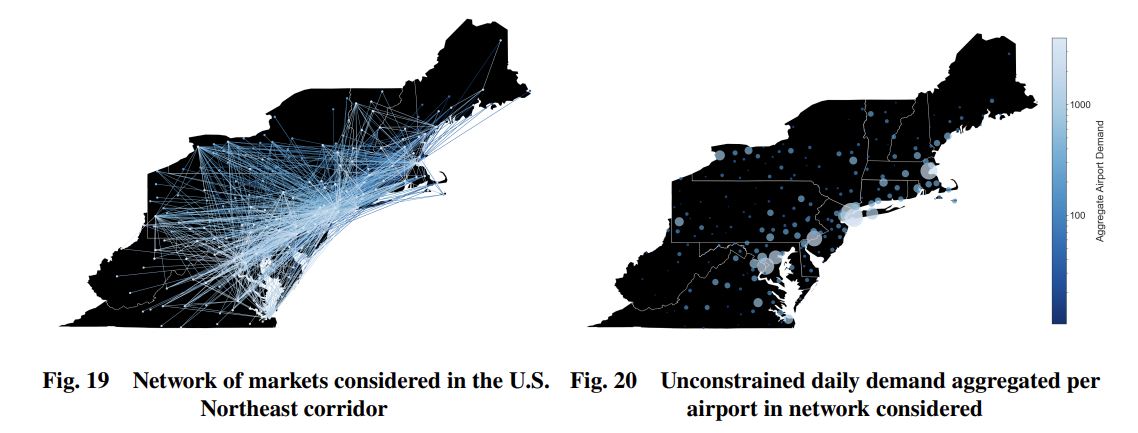
Finally, the network maps show how demand aggregates across airports. Even when the study focuses on thinner regional markets, larger metropolitan areas still show high total passenger counts because many viable origin-destination markets connect through them.
Why This Matters
This paper is useful because it treats RAM as an operational transportation system, not just an aircraft concept. The authors do not assume that better aircraft automatically create demand. They build a framework to estimate where the service competes with driving and conventional air travel.
The model also shows why door-to-door thinking is essential. A regional aircraft can be fast in the air but unattractive if the airport is too far away, the schedule is poor, or the total trip cost is too high. RAM demand depends on the full journey.
For planners, the main takeaway is that RAM is likely to work best in carefully selected markets:
- Trips long enough for meaningful time savings.
- Origin and destination areas with usable regional airports.
- Markets too thin for large-aircraft airline service but strong enough for smaller aircraft.
- Routes where nonstop service is possible.
- Business-heavy travel where time savings have high value.
Limitations
The model depends on several assumptions: future airport latency, future airfares, aircraft performance, traveler value of time, no induced demand, and the continued relevance of historical travel behavior. Real RAM adoption will also depend on reliability, safety perception, weather, airport access, service frequency, baggage convenience, and ticket prices.
The study also focuses on the Northeast Corridor. Other regions may behave differently. A RAM model for Tennessee, Texas, California, or the Mountain West would need local travel demand, airport geography, population distribution, and ground travel conditions.
Even with those caveats, the framework is valuable. It gives researchers and operators a disciplined way to move from “regional air mobility could be useful” to “these are the markets where it may actually compete.”
References
- Justin, C.Y., Payan, A.P. and Mavris, D., 2021. Demand modeling and operations optimization for advanced regional air mobility. In AIAA Aviation 2021 Forum (p. 3179). https://doi.org/10.2514/6.2021-3179
- McNally, M.G., 2007. The four-step model. In Hensher, D. and Button, K. (eds.), Handbook of Transport Modeling.
- U.S. Department of Transportation, Federal Highway Administration, Traveler Analysis Framework. https://www.fhwa.dot.gov/policyinformation/analysisframework/
- Bureau of Transportation Statistics, Origin and Destination Survey Data. https://www.bts.gov/topics/airlines-and-airports/origin-and-destination-survey-data
- Roy, S., Kotwicz Herniczek, M.T., German, B.J. and Garrow, L.A., 2021. User base estimation methodology for a business airport shuttle air taxi service. Journal of Air Transportation, 29(2), pp. 69-79.