Metropolitan and micropolitan statistical areas sound like dry geography labels, but they are useful tools for understanding how people, jobs, counties, and regional economies connect.
For Tennessee, these designations help explain why Nashville, Knoxville, Chattanooga, Memphis, and smaller regional centers are not just cities on a map. They are economic systems. People commute across county lines, businesses serve regional labor markets, hospitals draw patients from surrounding communities, and transportation networks depend on patterns that are larger than any single city.
That is why these statistical areas matter for mobility planning, including Regional Air Mobility. If we want to understand where people travel, where demand may emerge, and which communities are connected strongly enough to function as a region, metropolitan and micropolitan boundaries give us a practical starting point.
What Changed in 2003
On June 6, 2003, the U.S. Office of Management and Budget released revised definitions for Metropolitan Statistical Areas and introduced two important related concepts: Micropolitan Statistical Areas and Combined Statistical Areas. The definitions were later updated in December 2003 using newer population estimates from the Census Bureau.
These designations are meant to identify population cores and the surrounding counties that have strong social and economic ties to those cores. In practice, commuting patterns are one of the most important signals. If a large share of workers move between a core county and surrounding counties, those counties may be grouped into the same statistical area.
The key idea is simple: a region is not defined only by where people sleep. It is also defined by where they work, shop, study, receive services, and travel.
Metropolitan, Micropolitan, and Combined Areas
A Metropolitan Statistical Area, or MSA, has at least one Census-defined urbanized area with a population of 50,000 or more, along with surrounding counties that have strong commuting and economic ties to the core.
A Micropolitan Statistical Area is smaller. It has at least one urban cluster with a population between 10,000 and 50,000, again with surrounding counties added when commuting ties show meaningful integration.
A Combined Statistical Area, or CSA, links two or more adjacent metropolitan or micropolitan areas when there is significant employment interchange between them. A CSA is useful when separate regions function together in the labor market even if they remain distinct statistical areas.
These categories are county-based. That matters because counties often contain both urban and rural places. A rural resident may live inside a metropolitan statistical area because their county is economically tied to a city, not because their immediate neighborhood is urban.
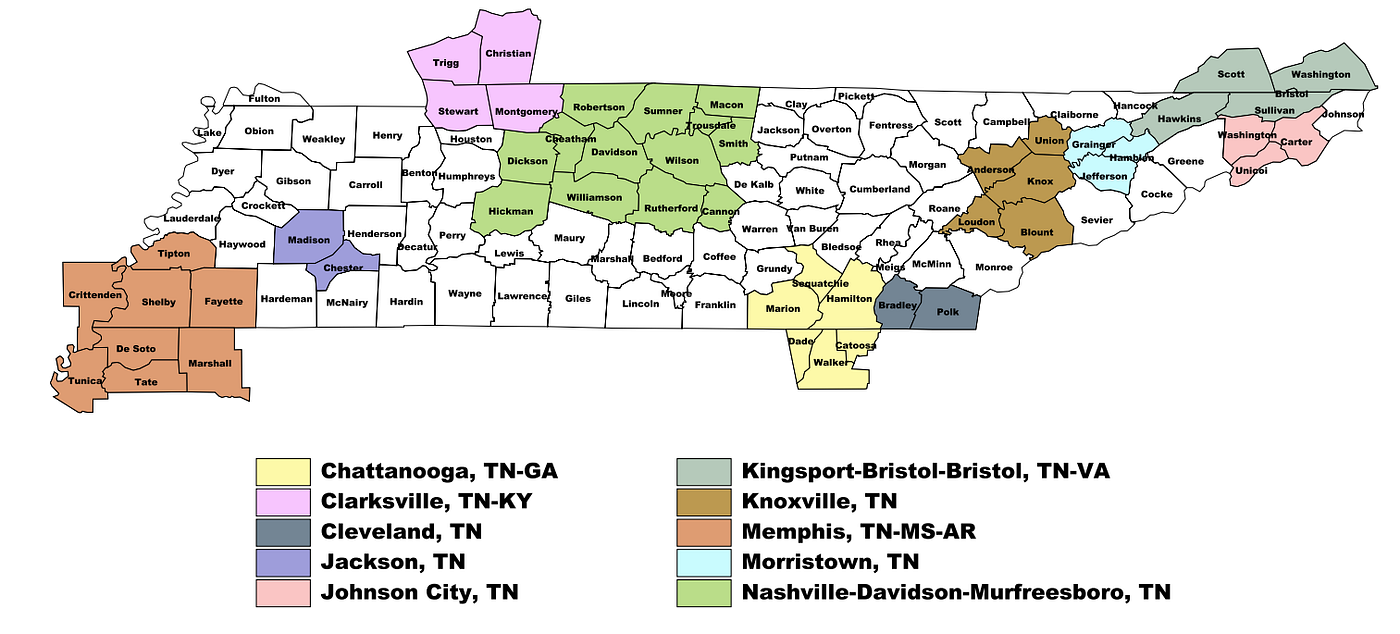
Tennessee’s Metropolitan Areas
Before the 2003 definition changes, Tennessee had seven Metropolitan Statistical Areas. Under the revised guidelines, three more were added, bringing the total to 10. One notable local change was the creation of the Morristown, TN MSA.
The Knoxville area also changed. Sevier County was removed from the Knoxville MSA, leaving Anderson, Blount, Knox, Loudon, and Union counties in that metro definition. Sevier County became the Sevierville Micropolitan Statistical Area instead.
This kind of change can look technical, but it has real planning implications. A county’s classification affects how analysts compare regions, how federal datasets are organized, how economic development stories are told, and how transportation demand is modeled.
Tennessee’s Micropolitan Areas
The 2003 definitions also designated 20 Micropolitan Statistical Areas in Tennessee.
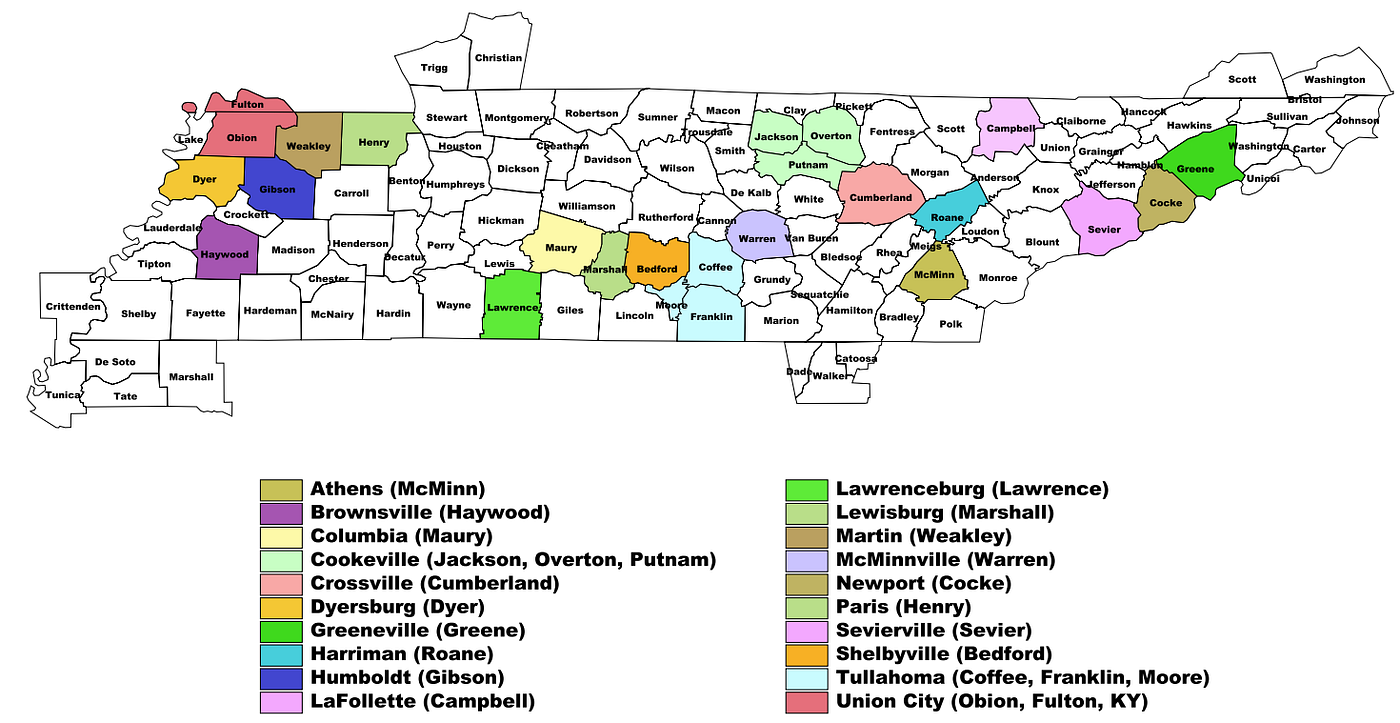
Micropolitan areas are especially important in a state like Tennessee because many communities are not large metropolitan hubs but still serve as regional centers. A micropolitan area may anchor healthcare, education, retail, manufacturing, government services, or tourism for nearby counties.
For transportation planning, these places should not be treated as isolated small towns. They often generate meaningful regional movement. They may also be candidates for improved bus service, highway investment, intercity rail analysis, airport access planning, or future regional air mobility studies.
Combined Statistical Areas
Combined Statistical Areas capture a broader regional relationship. They recognize that adjacent metro and micro areas can become linked through labor markets and commuting flows.
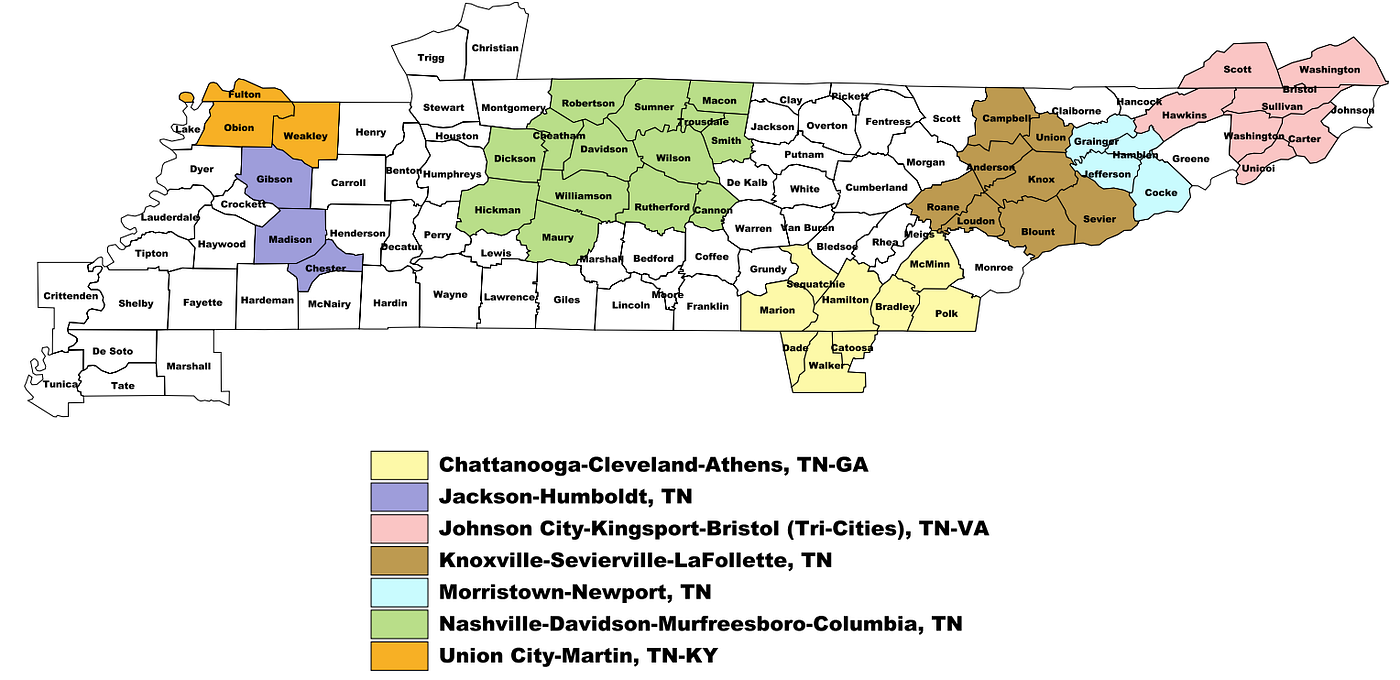
This is useful because real travel behavior does not always stop at a metro boundary. People may live in a micropolitan county, work in a nearby metro, shop in another county, and use an airport in a different region. A CSA helps capture that bigger economic footprint.
How Much of Tennessee Falls Inside These Areas
Under the 2003 framework described in this article, 38 of Tennessee’s 95 counties were part of Metropolitan Statistical Areas. Another 24 counties were included in Micropolitan Statistical Areas. The Tennessee-centered statistical areas also included counties from neighboring states such as Kentucky, Virginia, Georgia, Mississippi, and Arkansas.
At that time, about 73% of Tennessee residents lived in metropolitan-area counties, totaling roughly 4.2 million people. Another 17%, about 982,000 people, lived in micropolitan-area counties. That left about 10% of the state population outside a designated metropolitan or micropolitan area.
This does not mean only 10% of Tennesseans lived in rural settings. Because these designations use whole counties, a county can contain both dense towns and rural landscapes. A person can live in a rural part of a county and still be counted inside a metropolitan or micropolitan statistical area.
Why Sevier County Was Treated Differently
Sevier County is a useful example because it shows how these designations work.
Sevierville had enough population to support a micropolitan designation, but Sevier County did not meet the commuting-integration threshold required to remain part of the Knoxville MSA under the revised definition. By contrast, counties such as Anderson and Blount were included in the Knoxville MSA because their labor markets were more strongly tied to Knox County.
For example, a significant share of workers from Anderson and Blount counties commuted to Knox County, and enough employment exchange occurred across those county lines to meet the integration criteria. Sevier County had a different pattern, so it was classified separately as the Sevierville Micropolitan Statistical Area.
That distinction is useful. It prevents every nearby county from being automatically folded into the largest metro. Instead, the boundary reflects measured economic interaction.
Why These Boundaries Matter
Metropolitan and micropolitan designations are widely used in public policy, business analysis, transportation planning, real estate, healthcare planning, academic research, and federal statistics.
For regional mobility work, they are especially helpful because they create consistent units of analysis. Instead of modeling every trip between individual addresses, analysts can group travel demand by county-based regions. That makes it easier to study commuting flows, airport catchment areas, intercity travel demand, and potential regional air mobility markets.
In Tennessee, this matters because the state has a mix of large metros, smaller regional centers, rural communities, tourism corridors, and cross-border economic regions. A good transportation model needs to recognize those differences.
A Note on Current Boundaries
The maps and counts discussed here come from the 2003 OMB/Census framework reflected in the original post. These boundaries are not permanent. OMB updates metropolitan and micropolitan delineations periodically as population patterns and commuting flows change.
For current analysis, readers should check the latest Census Bureau and OMB files. In 2023, for example, Tennessee maintained 10 Metropolitan Statistical Areas, but county assignments changed for several areas after updated Census and commuting data were incorporated.
The broader lesson remains the same: Tennessee’s mobility patterns are regional. Metropolitan and micropolitan areas help make those patterns visible.
References
- U.S. Census Bureau, 2003 State-based Metropolitan and Micropolitan Statistical Areas Maps. https://www.census.gov/geographies/reference-maps/2003/geo/statecbsa.html
- U.S. Census Bureau, Metropolitan and Micropolitan Statistical Areas. https://www.census.gov/programs-surveys/metro-micro.html
- Tennessee State Data Center, 2023. New Metropolitan and Micropolitan Area Boundaries Include Changes for Eight Tennessee Counties. https://tnsdc.utk.edu/2023/08/21/new-metropolitan-and-micropolitan-area-boundaries-include-changes-for-eight-tennessee-counties/