Flight demand forecasting is one of the quiet engines behind airline revenue management.
Before a flight departs, airlines must decide how many seats to make available in each fare class, when to close lower fare classes, how much demand to expect, and how aggressively to protect inventory for later, higher-value passengers. If demand is underestimated, seats may sell too cheaply or sell out too early. If demand is overestimated, seats may go empty.
The paper Support vector regression model for flight demand forecasting addresses this problem by using Support Vector Regression (SVR) to predict final flight bookings from early booking behavior. Instead of relying only on the current booking count and day-of-week information, the proposed model uses a vector of historical bookings across the pre-sale period. This gives the model more context about how demand is developing before departure.
The authors also divide flights into peak, medium, and off-season groups, called PMO categories, and combine this with day-of-week patterns. That matters because bookings are not random. They fluctuate, but they still show seasonal and weekly structure.
Flight booking data analysis
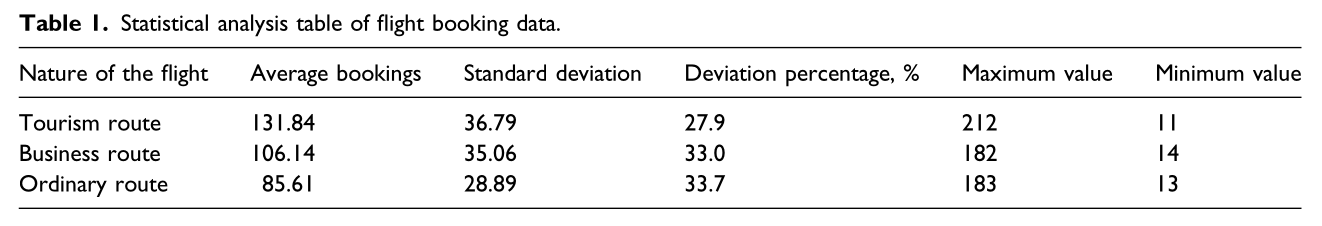
Flight bookings can look noisy at first. Some days fill quickly, others slowly. Tourism routes behave differently from business routes. Mondays may not look like Sundays. But underneath the noise, the paper finds two important patterns.
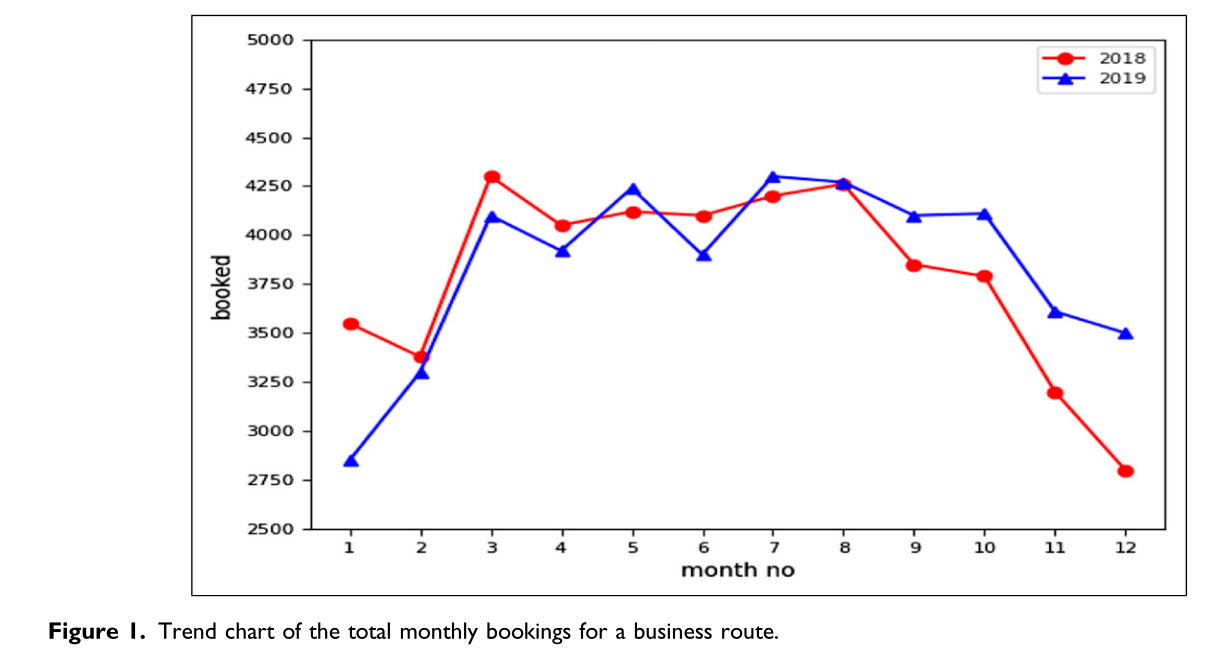
First, demand has seasonality. Flights can be grouped into peak, medium, and off-season periods. For a business route in the paper, March through August shows stronger demand, January and November-December are weaker, and February and September fall in between.
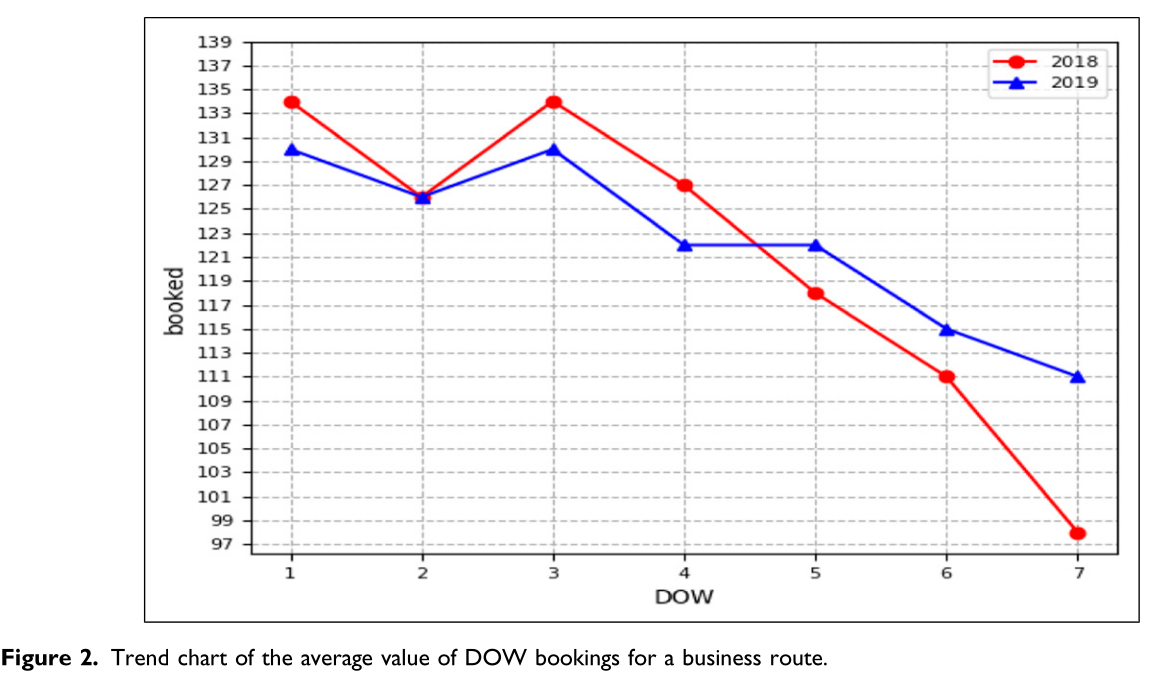
Second, demand varies by day of week. For the business route example, bookings are higher in the first three days of the week and lowest on Sunday.
These patterns motivate the paper’s core modeling choice: build forecasting models on classified data, rather than treating every flight as if it belongs to the same demand environment.
Organization of data and detruncation
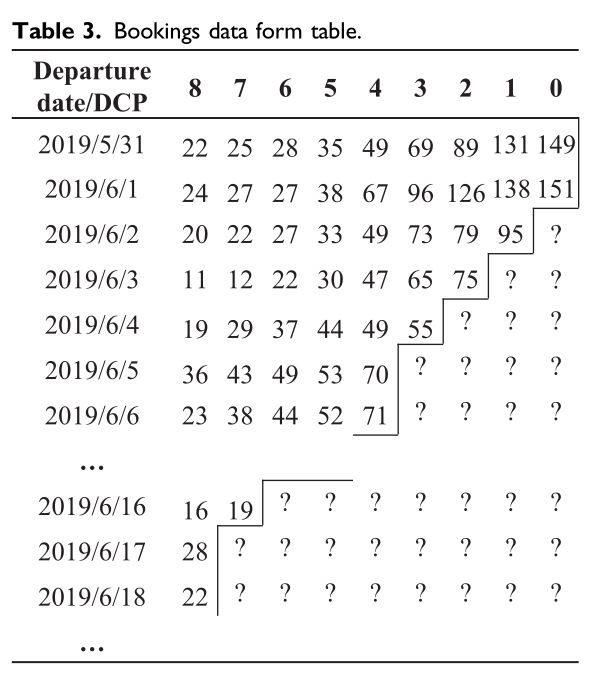
Booking Data and DCPs
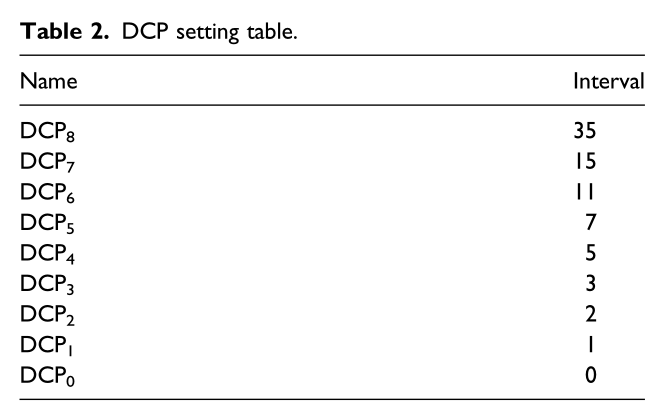
Chinese domestic flights generally open for sale about 180 days before departure. During this pre-sale period, booking counts are collected at predefined data collection points, or DCPs.
In this study, nine DCPs are used. DCP8 is 35 days before departure, while DCP0 is the final booking count after departure and serves as the forecasting target.
The forecasting question is:
Given the bookings observed so far,
what will the final booking count be at departure?
For historical flights that have already departed, all DCP values are known. For future flights still in the pre-sale period, later DCP values are missing because those dates have not arrived yet. The model must forecast DCP0 using the currently available DCP history.
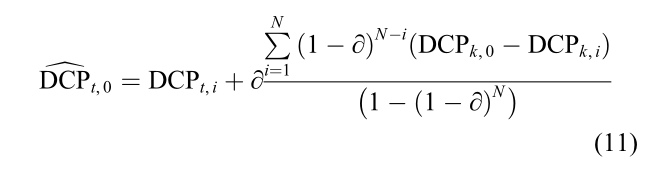
Detruncation
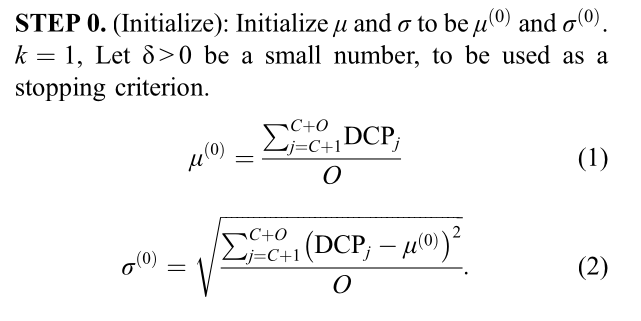
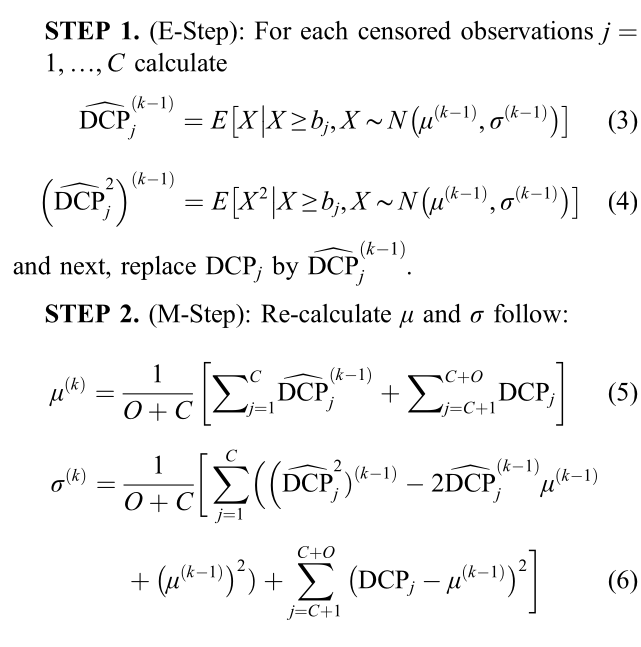
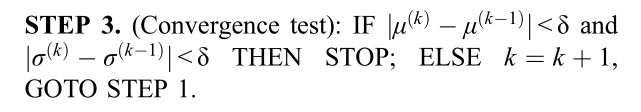
Before forecasting, the paper performs detruncation.
This matters because airline booking data can be constrained. If a fare class is closed, observed bookings may not reflect true demand. The flight may have received more demand than the booking records show, but the system stopped accepting some bookings due to inventory controls.
To adjust for this, the authors use an Expectation-Maximization (EM) algorithm. The goal is to estimate what demand might have looked like if it had not been artificially limited by booking controls.
Forecasting Models
Pick-up model
The pick-up model is a traditional airline forecasting method. It estimates how many additional bookings usually arrive between the current DCP and departure for similar flights.
If a future flight currently has 80 bookings, and similar historical flights usually gained 30 more bookings after this DCP, the forecast becomes 110.
This approach is simple and interpretable, but it assumes that future booking pickup behaves like the historical average.

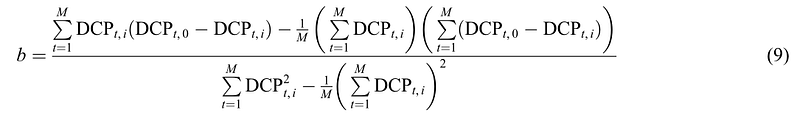
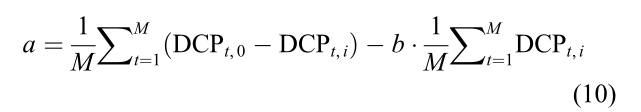
Linear regression model
Linear regression models the relationship between current bookings and final bookings using a straight-line relationship. It is easy to estimate and understand, but it may struggle when booking behavior is nonlinear or disrupted by irregular demand patterns.

Exponential smoothing model
Exponential smoothing gives more weight to recent observations while still using older data. It is useful when demand changes over time and recent booking behavior should matter more than older patterns.
However, it still relies on a relatively simple temporal structure. It does not fully use the shape of the early booking curve as a feature vector.
SVR model
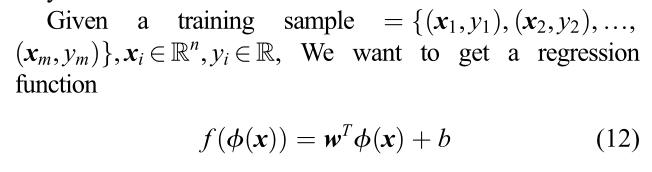
Support Vector Regression is the paper’s main proposed model.
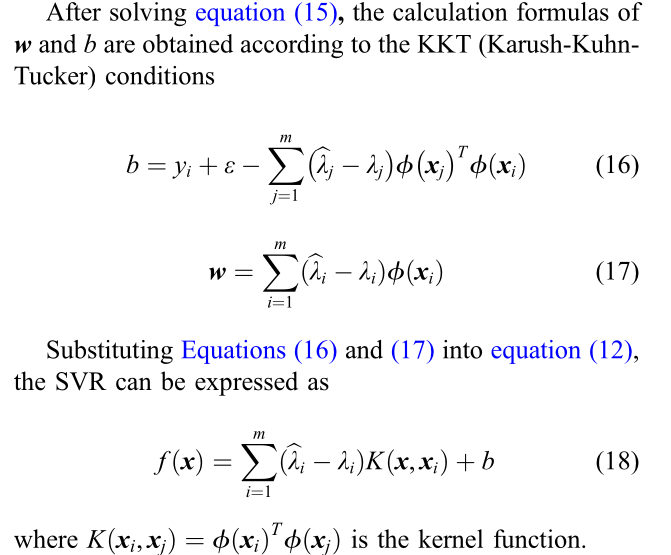
SVR is useful when the relationship between inputs and outputs is nonlinear. It maps the input data into a higher-dimensional feature space and learns a regression function that balances prediction error and model complexity.
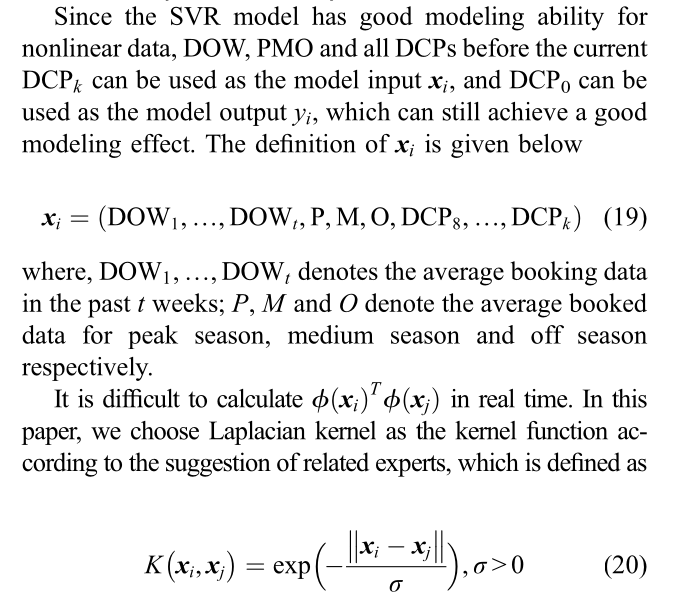
In this paper, the input to SVR is richer than in the traditional models. Instead of using only the current DCP booking count, the model uses a vector of cumulative bookings from the early pre-sale period. That means the model can learn from the trajectory of bookings, not just one snapshot.
This is the key improvement:
traditional models: current booking count + DOW/season
SVR model: early booking sequence + current booking count + classification context
The model is especially attractive for flight bookings because booking curves can fluctuate. SVR can adapt to nonlinear random changes better than simple pickup or smoothing models.
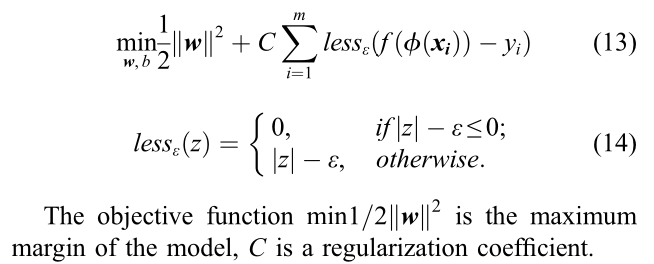
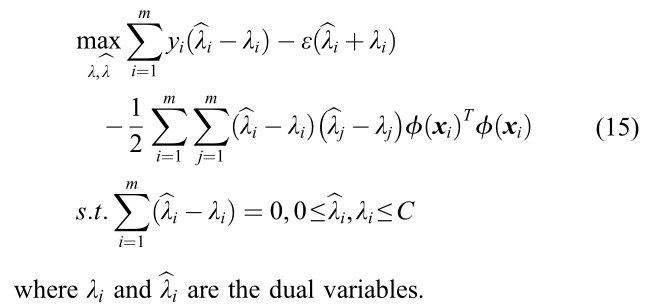
Equation (13) is convex quadratic programming problem, its dual problem can be obtained by using Lagrangian relaxation as equation (15).
Data set
The numerical study uses complete booking data from 24 round-trip flights across three route types from a Chinese airline:
- business routes,
- tourism routes,
- general routes.
The training set covers January 2018 through October 31, 2019, with 29,363 flights. The testing set covers November 1 through December 31, 2019, with 2,192 flights. The data is pre-COVID, so the experiment reflects more normal operating conditions.
The dataset also contains incomplete or dirty records, around 10%, which reinforces the need for cleaning and detruncation.
Performance evaluation index
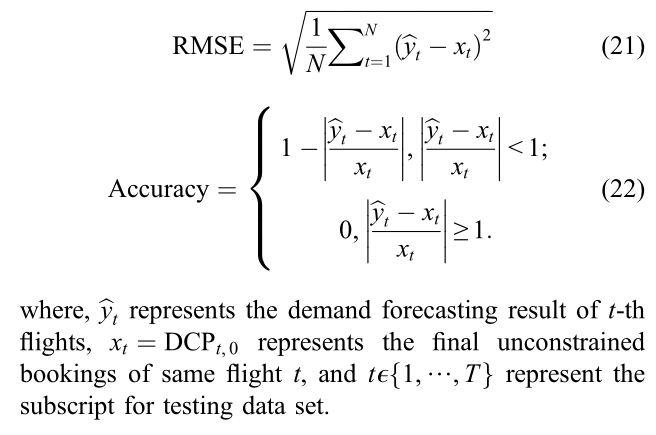
The paper evaluates performance using RMSE and accuracy.
RMSE measures the size of forecasting errors, with lower values being better. Accuracy is defined from the relative error between predicted demand and final observed demand.
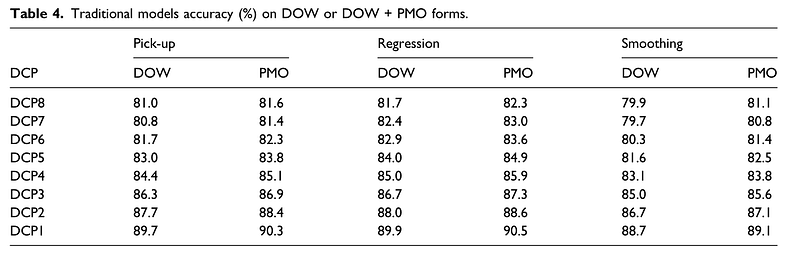
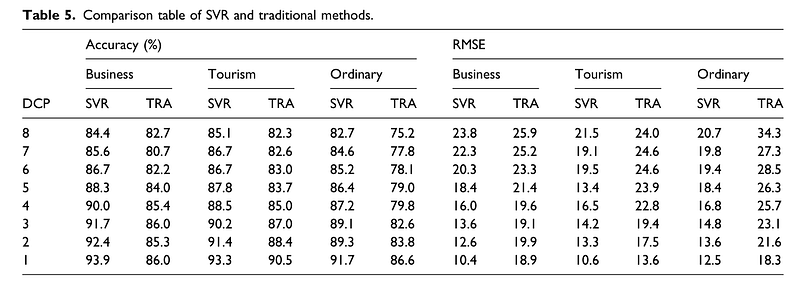
Results
The results show that the SVR model improves forecasting accuracy and reduces RMSE compared with the traditional pickup, linear regression, and exponential smoothing models.
The practical reason is clear. Traditional models mostly use the current booking count and broad attributes such as DOW and PMO. SVR uses more of the early booking sequence, so it can recognize richer demand patterns.
Why It Matters
For airlines, better flight demand forecasting directly supports revenue management. More accurate forecasts help set booking limits, guide pricing decisions, allocate seats across fare classes, and reduce the risk of empty seats or unnecessary spill.
The paper’s contribution is not simply that SVR is another regression model. It reframes flight demand forecasting as a sequence-learning problem over the booking curve. That is a more realistic view of airline demand because early booking behavior contains valuable signals about final demand.
Limitations
The study uses data from one airline and selected domestic routes in China. Results may vary across markets, international routes, low-cost carriers, irregular operations, and post-pandemic demand environments.
The SVR model also depends on careful classification of seasons, DOW effects, and clean DCP data. If the booking process changes, the model should be retrained and validated.
Still, the approach is practical: use more of the booking history, account for seasonality, correct constrained observations, and choose a model flexible enough to learn nonlinear booking patterns.
References
- Fan, W., Wu, X., Shi, X.Y., Zhang, C., Wai Hung, I., Kai Leung, Y. and Zeng, L.S., 2023. Support vector regression model for flight demand forecasting. International Journal of Engineering Business Management, 15, p.18479790231174318. DOI