Machine learning often looks most impressive when data is abundant. Give a model millions of examples, enough computing power, and careful tuning, and it can discover patterns that are hard for humans to see.
But many real scientific problems do not look like that.
In health science, biology, clinical research, and many observational studies, a researcher may have only a few hundred samples. Each sample may be expensive, difficult, or ethically complicated to collect. The goal is not only to make a prediction, but also to understand what the model has learned. In that setting, the usual machine learning playbook becomes risky. Flexible models can fit the training data beautifully and then fail when tested on new cases.
That is the problem Casper Wilstrup and Jaan Kasak explore in their paper, Symbolic regression outperforms other models for small data sets. Their central claim is direct: when the training set is small, symbolic regression can generalize better than several common machine learning models while still producing equations that humans can inspect.
This matters because small-data modeling is not a niche inconvenience. It is the normal condition in many serious research settings.
Background
Small data puts every model under pressure.
A linear regression model is easy to understand, but it forces the researcher to choose a simple structure in advance. If the real relationship contains nonlinear effects or feature interactions, a linear model may miss them.
A decision tree is more flexible and still easy to inspect, but it can become unstable and overfit unless its depth is restricted. Random forests and gradient boosting go further by combining many trees into powerful ensembles. These models often learn the training data very well, but their internal logic is difficult to read directly. You can use feature importance tools or explanation methods, but the model itself is no longer a simple scientific statement.
Symbolic regression tries to occupy a useful middle ground. Instead of choosing a fixed equation beforehand, it searches for an equation. The result is a mathematical expression that maps inputs (X) to an output (Y). That expression can include simple operations, nonlinear transformations, and interactions, but it remains something a person can read and challenge.
That combination is the attraction: more flexible than a preset linear model, more interpretable than a large ensemble.
What Is QLattice?
The study uses a symbolic regression system called QLattice, implemented through Feyn. QLattice searches through possible mathematical expressions and returns candidate functions ranked by how well they explain the observed data.
In practical terms, the model is not trying to build hundreds of trees or hide the relationship inside a dense black box. It is trying to discover a compact formula. That formula may be imperfect, but it is inspectable. A researcher can look at the variables, signs, nonlinear terms, and interactions and ask whether the expression makes sense in the domain.
This is especially valuable in scientific settings. A model that predicts well is useful. A model that predicts well and offers a plausible explanation is often much more useful.
Methods
The benchmark was designed to simulate a common small-data situation.
The authors selected regression data sets from the Penn Machine Learning Benchmarks collection. They kept only data sets with at least 1000 observations, so that each experiment could use a small training set while still preserving a large holdout set for validation.
The final benchmark included:
- 48 regression data sets,
- 250 training observations per experiment,
- at least 750 out-of-sample validation observations,
- 5 random training samples per data set,
- 240 total model-comparison cases.
The models were evaluated using validation (R^2), which measures how well predictions generalize to unseen data. This setup is important. The study was not asking which model can memorize 250 rows best. It was asking which model can learn from 250 rows and still perform well on the much larger set of held-out observations.
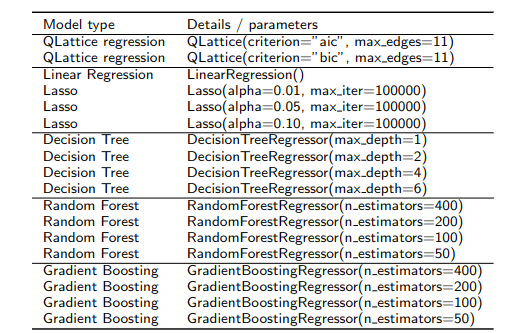
The comparison included both interpretable and less interpretable models:
- QLattice symbolic regression,
- ordinary linear regression and Lasso regression,
- shallow decision trees,
- random forest regression,
- gradient boosting regression.
The QLattice models were tested with AIC and BIC criteria, both of which penalize unnecessary complexity. The other models were tested with typical configurations, such as different tree depths or different numbers of estimators.
Results
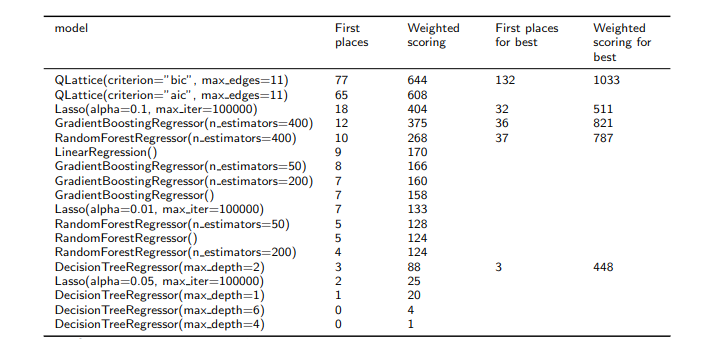
The results strongly favored symbolic regression.
Across all model configurations, QLattice with BIC achieved the best validation performance in 77 of the 240 experiments. QLattice with AIC came second with 65 first-place finishes. The best non-symbolic configuration was Lasso regression with (\alpha = 0.1), which won 18 cases.
The authors also compared the best-performing configuration from each model family. In that comparison, QLattice with BIC performed best in 132 out of 240 cases. Random forest was the next strongest by first-place count, winning 37 cases, followed by Lasso with 32 cases.
The interpretability comparison was even more striking. When QLattice was compared only against inspectable models such as Lasso and a shallow decision tree, it performed best in 184 out of 240 cases.
That is the key result of the paper: symbolic regression did not merely preserve interpretability as a nice extra. In this benchmark, it also generalized better.
Why Symbolic Regression Helped
The likely reason is complexity control.
With only 250 training examples, a flexible model has many opportunities to learn noise. Random forests and gradient boosting can produce strong training performance, but the paper’s scatter plots show that they often learned the training set better than they generalized to validation data.
Symbolic regression behaves differently. Because it searches for concise mathematical expressions and penalizes unnecessary complexity, it has a built-in preference for simpler explanations. This is Occam’s razor in model form: when data is scarce, a simpler explanation is often more trustworthy than a highly flexible one.
That does not mean symbolic regression will always win. The result depends on the data, the implementation, the search settings, and the benchmark design. The paper also notes that some of the selected PMLB data sets were synthetic, which is worth keeping in mind when interpreting the results.
Still, the takeaway is practical. If you have a small data set and you care about generalization, symbolic regression deserves serious consideration. If you also need to explain the model to scientists, clinicians, or decision-makers, it becomes even more attractive.
The Bigger Lesson
This paper is not just a scoreboard showing one model beating another. It is a reminder that the best model depends on the scientific situation.
When data is massive and prediction is the only goal, black-box ensembles and deep learning systems may be reasonable choices. But when data is limited, every extra degree of freedom is dangerous. A model that looks impressive on the training set may simply be telling us what it memorized.
Symbolic regression offers a different promise: learn a compact relationship, test it on unseen data, and leave behind an equation that humans can inspect.
For small-data science, that is a powerful combination. It keeps prediction connected to explanation, and it gives researchers something they can reason about instead of only a number to report.
References
- Wilstrup, C. and Kasak, J., 2021. Symbolic regression outperforms other models for small data sets. arXiv preprint arXiv:2103.15147. PDF
- https://github.com/wilstrup/sr-small-data
- Romano, J.D., Le, T.T., La Cava, W., Gregg, J.T., Goldberg, D.J., Chakraborty, P., Ray, N.L., Himmelstein, D., Fu, W. and Moore, J.H., 2022. PMLB v1. 0: an open-source dataset collection for benchmarking machine learning methods. Bioinformatics, 38(3), pp.878–880.